Dutch West Indian vs Immigrants from Sweden 11th Grade
COMPARE
Dutch West Indian
Immigrants from Sweden
11th Grade
11th Grade Comparison
Dutch West Indians
Immigrants from Sweden
90.7%
11TH GRADE
0.0/ 100
METRIC RATING
281st/ 347
METRIC RANK
93.9%
11TH GRADE
99.8/ 100
METRIC RATING
64th/ 347
METRIC RANK
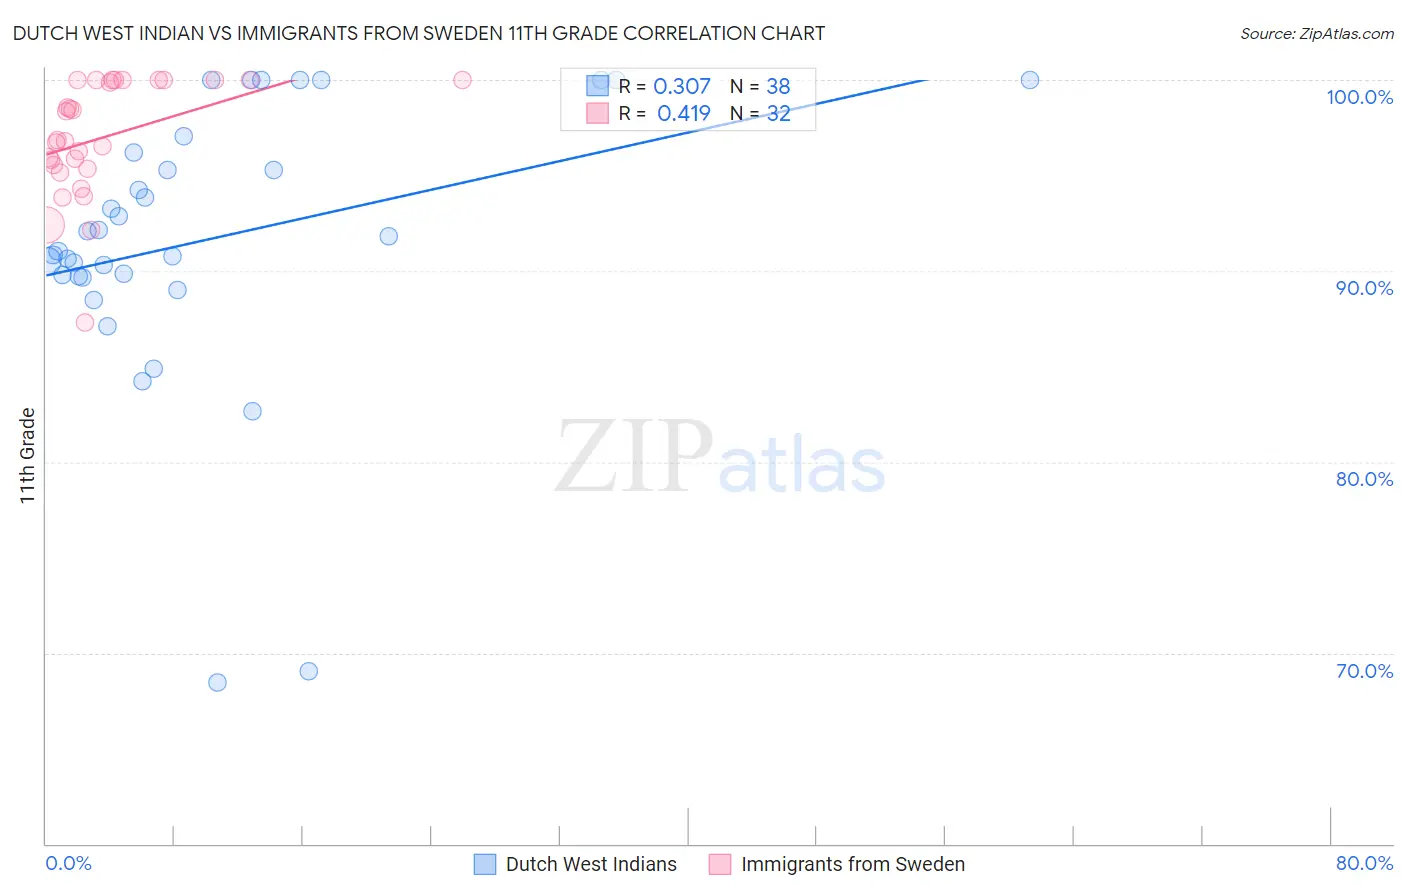
Dutch West Indian vs Immigrants from Sweden 11th Grade Correlation Chart
The statistical analysis conducted on geographies consisting of 85,776,098 people shows a mild positive correlation between the proportion of Dutch West Indians and percentage of population with at least 11th grade education in the United States with a correlation coefficient (R) of 0.307 and weighted average of 90.7%. Similarly, the statistical analysis conducted on geographies consisting of 164,736,894 people shows a moderate positive correlation between the proportion of Immigrants from Sweden and percentage of population with at least 11th grade education in the United States with a correlation coefficient (R) of 0.419 and weighted average of 93.9%, a difference of 3.6%.
11th Grade Correlation Summary
| Measurement | Dutch West Indian | Immigrants from Sweden |
| Minimum | 68.4% | 87.3% |
| Maximum | 100.0% | 100.0% |
| Range | 31.6% | 12.7% |
| Mean | 91.6% | 97.0% |
| Median | 91.4% | 96.8% |
| Interquartile 25% (IQ1) | 89.7% | 95.5% |
| Interquartile 75% (IQ3) | 96.2% | 100.0% |
| Interquartile Range (IQR) | 6.5% | 4.5% |
| Standard Deviation (Sample) | 7.2% | 3.0% |
| Standard Deviation (Population) | 7.1% | 3.0% |
Similar Demographics by 11th Grade
Demographics Similar to Dutch West Indians by 11th Grade
In terms of 11th grade, the demographic groups most similar to Dutch West Indians are Immigrants from St. Vincent and the Grenadines (90.7%, a difference of 0.010%), Immigrants from Barbados (90.7%, a difference of 0.020%), Sri Lankan (90.7%, a difference of 0.050%), Barbadian (90.8%, a difference of 0.12%), and Malaysian (90.8%, a difference of 0.16%).
| Demographics | Rating | Rank | 11th Grade |
| Immigrants | Trinidad and Tobago | 0.1 /100 | #274 | Tragic 90.9% |
| Immigrants | South Eastern Asia | 0.1 /100 | #275 | Tragic 90.9% |
| Bangladeshis | 0.1 /100 | #276 | Tragic 90.9% |
| Immigrants | Congo | 0.1 /100 | #277 | Tragic 90.9% |
| Malaysians | 0.1 /100 | #278 | Tragic 90.8% |
| Barbadians | 0.0 /100 | #279 | Tragic 90.8% |
| Sri Lankans | 0.0 /100 | #280 | Tragic 90.7% |
| Dutch West Indians | 0.0 /100 | #281 | Tragic 90.7% |
| Immigrants | St. Vincent and the Grenadines | 0.0 /100 | #282 | Tragic 90.7% |
| Immigrants | Barbados | 0.0 /100 | #283 | Tragic 90.7% |
| Immigrants | Laos | 0.0 /100 | #284 | Tragic 90.5% |
| Immigrants | Burma/Myanmar | 0.0 /100 | #285 | Tragic 90.4% |
| Immigrants | West Indies | 0.0 /100 | #286 | Tragic 90.4% |
| Apache | 0.0 /100 | #287 | Tragic 90.4% |
| Pennsylvania Germans | 0.0 /100 | #288 | Tragic 90.3% |
Demographics Similar to Immigrants from Sweden by 11th Grade
In terms of 11th grade, the demographic groups most similar to Immigrants from Sweden are Native Hawaiian (93.9%, a difference of 0.0%), Alaskan Athabascan (93.9%, a difference of 0.020%), Immigrants from Netherlands (93.9%, a difference of 0.020%), Ukrainian (94.0%, a difference of 0.030%), and Zimbabwean (93.9%, a difference of 0.040%).
| Demographics | Rating | Rank | 11th Grade |
| New Zealanders | 99.9 /100 | #57 | Exceptional 94.0% |
| Iranians | 99.9 /100 | #58 | Exceptional 94.0% |
| Bhutanese | 99.8 /100 | #59 | Exceptional 94.0% |
| Okinawans | 99.8 /100 | #60 | Exceptional 94.0% |
| Immigrants | Belgium | 99.8 /100 | #61 | Exceptional 94.0% |
| Austrians | 99.8 /100 | #62 | Exceptional 94.0% |
| Ukrainians | 99.8 /100 | #63 | Exceptional 94.0% |
| Immigrants | Sweden | 99.8 /100 | #64 | Exceptional 93.9% |
| Native Hawaiians | 99.8 /100 | #65 | Exceptional 93.9% |
| Alaskan Athabascans | 99.8 /100 | #66 | Exceptional 93.9% |
| Immigrants | Netherlands | 99.8 /100 | #67 | Exceptional 93.9% |
| Zimbabweans | 99.8 /100 | #68 | Exceptional 93.9% |
| Scotch-Irish | 99.8 /100 | #69 | Exceptional 93.9% |
| Immigrants | England | 99.7 /100 | #70 | Exceptional 93.8% |
| Immigrants | South Africa | 99.7 /100 | #71 | Exceptional 93.8% |