Kiowa vs Immigrants from Morocco Associate's Degree
COMPARE
Kiowa
Immigrants from Morocco
Associate's Degree
Associate's Degree Comparison
Kiowa
Immigrants from Morocco
36.5%
ASSOCIATE'S DEGREE
0.0/ 100
METRIC RATING
326th/ 347
METRIC RANK
49.2%
ASSOCIATE'S DEGREE
96.3/ 100
METRIC RATING
109th/ 347
METRIC RANK
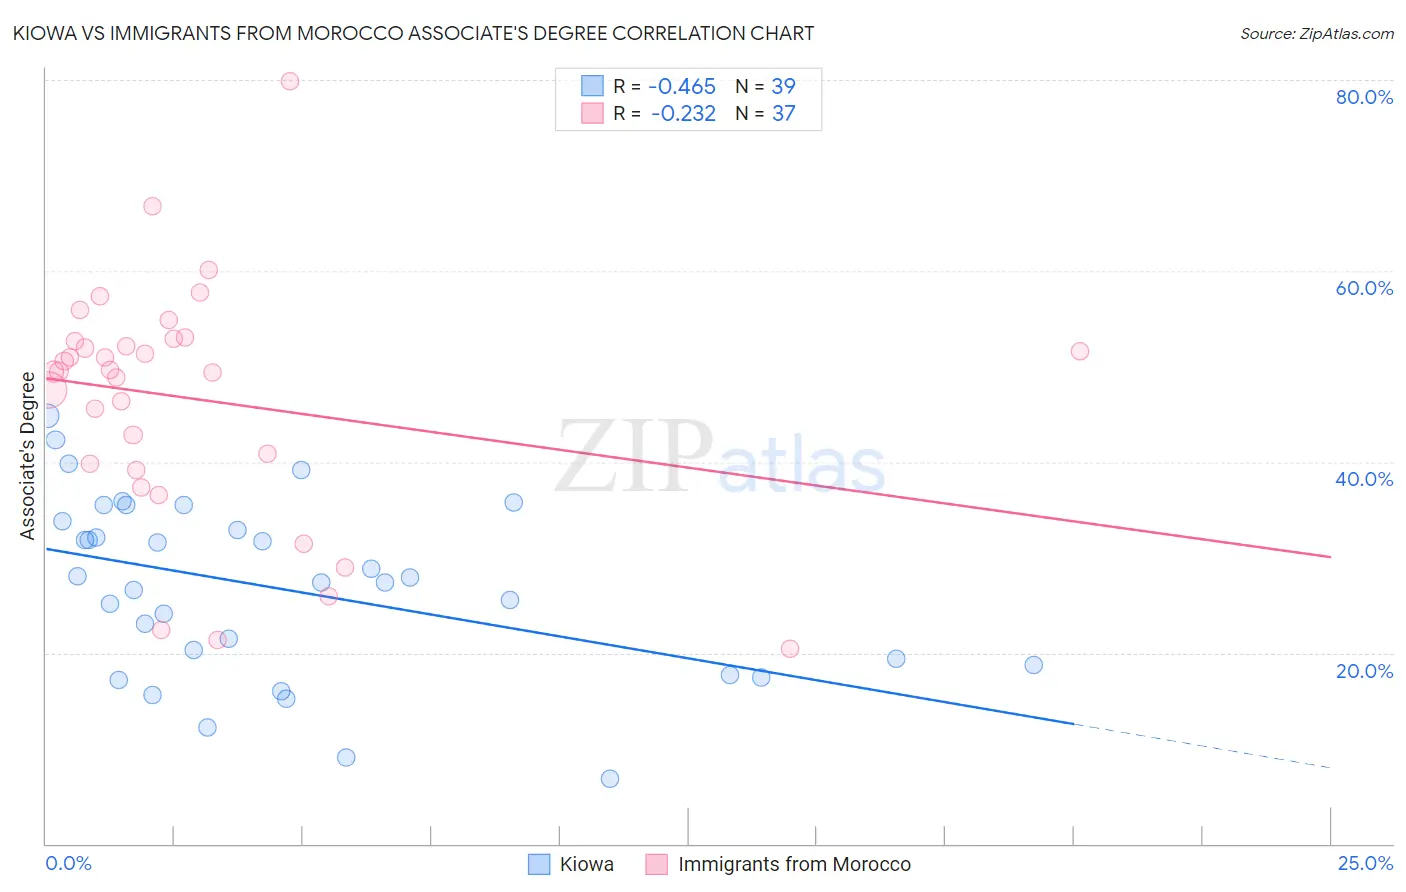
Kiowa vs Immigrants from Morocco Associate's Degree Correlation Chart
The statistical analysis conducted on geographies consisting of 56,101,363 people shows a moderate negative correlation between the proportion of Kiowa and percentage of population with at least associate's degree education in the United States with a correlation coefficient (R) of -0.465 and weighted average of 36.5%. Similarly, the statistical analysis conducted on geographies consisting of 178,912,438 people shows a weak negative correlation between the proportion of Immigrants from Morocco and percentage of population with at least associate's degree education in the United States with a correlation coefficient (R) of -0.232 and weighted average of 49.2%, a difference of 34.8%.
Associate's Degree Correlation Summary
| Measurement | Kiowa | Immigrants from Morocco |
| Minimum | 6.8% | 20.4% |
| Maximum | 44.8% | 79.9% |
| Range | 38.0% | 59.4% |
| Mean | 26.7% | 46.6% |
| Median | 27.3% | 49.4% |
| Interquartile 25% (IQ1) | 18.7% | 39.4% |
| Interquartile 75% (IQ3) | 33.7% | 52.8% |
| Interquartile Range (IQR) | 15.0% | 13.4% |
| Standard Deviation (Sample) | 9.3% | 12.5% |
| Standard Deviation (Population) | 9.2% | 12.3% |
Similar Demographics by Associate's Degree
Demographics Similar to Kiowa by Associate's Degree
In terms of associate's degree, the demographic groups most similar to Kiowa are Dutch West Indian (36.5%, a difference of 0.020%), Alaskan Athabascan (36.5%, a difference of 0.030%), Paiute (36.4%, a difference of 0.32%), Menominee (36.7%, a difference of 0.56%), and Apache (36.2%, a difference of 0.63%).
| Demographics | Rating | Rank | Associate's Degree |
| Fijians | 0.0 /100 | #319 | Tragic 37.4% |
| Cajuns | 0.0 /100 | #320 | Tragic 37.4% |
| Immigrants | Yemen | 0.0 /100 | #321 | Tragic 37.3% |
| Pennsylvania Germans | 0.0 /100 | #322 | Tragic 37.2% |
| Immigrants | Cabo Verde | 0.0 /100 | #323 | Tragic 36.8% |
| Arapaho | 0.0 /100 | #324 | Tragic 36.7% |
| Menominee | 0.0 /100 | #325 | Tragic 36.7% |
| Kiowa | 0.0 /100 | #326 | Tragic 36.5% |
| Dutch West Indians | 0.0 /100 | #327 | Tragic 36.5% |
| Alaskan Athabascans | 0.0 /100 | #328 | Tragic 36.5% |
| Paiute | 0.0 /100 | #329 | Tragic 36.4% |
| Apache | 0.0 /100 | #330 | Tragic 36.2% |
| Immigrants | Azores | 0.0 /100 | #331 | Tragic 35.6% |
| Immigrants | Central America | 0.0 /100 | #332 | Tragic 35.0% |
| Mexicans | 0.0 /100 | #333 | Tragic 35.0% |
Demographics Similar to Immigrants from Morocco by Associate's Degree
In terms of associate's degree, the demographic groups most similar to Immigrants from Morocco are Jordanian (49.2%, a difference of 0.13%), Syrian (49.3%, a difference of 0.20%), Austrian (49.1%, a difference of 0.22%), Croatian (49.3%, a difference of 0.23%), and Immigrants from Italy (49.3%, a difference of 0.23%).
| Demographics | Rating | Rank | Associate's Degree |
| Chileans | 97.3 /100 | #102 | Exceptional 49.4% |
| Ukrainians | 97.1 /100 | #103 | Exceptional 49.4% |
| Venezuelans | 97.0 /100 | #104 | Exceptional 49.4% |
| Croatians | 96.8 /100 | #105 | Exceptional 49.3% |
| Immigrants | Italy | 96.7 /100 | #106 | Exceptional 49.3% |
| Syrians | 96.7 /100 | #107 | Exceptional 49.3% |
| Jordanians | 96.6 /100 | #108 | Exceptional 49.2% |
| Immigrants | Morocco | 96.3 /100 | #109 | Exceptional 49.2% |
| Austrians | 95.8 /100 | #110 | Exceptional 49.1% |
| Immigrants | Venezuela | 95.8 /100 | #111 | Exceptional 49.1% |
| Immigrants | Chile | 95.3 /100 | #112 | Exceptional 49.0% |
| Palestinians | 95.3 /100 | #113 | Exceptional 49.0% |
| Arabs | 95.3 /100 | #114 | Exceptional 49.0% |
| Luxembourgers | 95.1 /100 | #115 | Exceptional 48.9% |
| British | 95.0 /100 | #116 | Exceptional 48.9% |