Immigrants from Dominica vs Immigrants from Morocco Associate's Degree
COMPARE
Immigrants from Dominica
Immigrants from Morocco
Associate's Degree
Associate's Degree Comparison
Immigrants from Dominica
Immigrants from Morocco
40.5%
ASSOCIATE'S DEGREE
0.1/ 100
METRIC RATING
274th/ 347
METRIC RANK
49.2%
ASSOCIATE'S DEGREE
96.3/ 100
METRIC RATING
109th/ 347
METRIC RANK
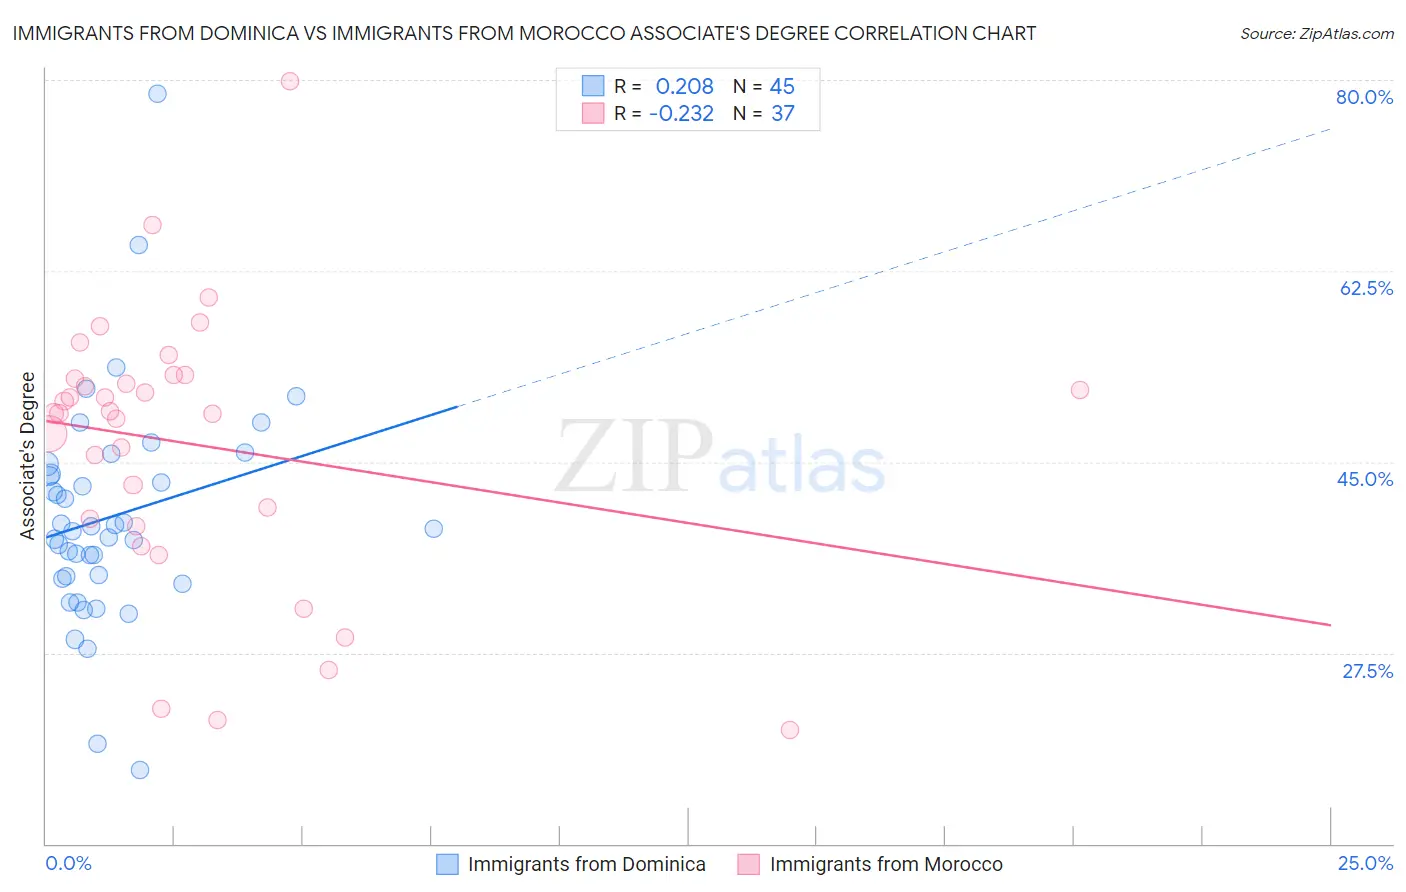
Immigrants from Dominica vs Immigrants from Morocco Associate's Degree Correlation Chart
The statistical analysis conducted on geographies consisting of 83,795,636 people shows a weak positive correlation between the proportion of Immigrants from Dominica and percentage of population with at least associate's degree education in the United States with a correlation coefficient (R) of 0.208 and weighted average of 40.5%. Similarly, the statistical analysis conducted on geographies consisting of 178,912,438 people shows a weak negative correlation between the proportion of Immigrants from Morocco and percentage of population with at least associate's degree education in the United States with a correlation coefficient (R) of -0.232 and weighted average of 49.2%, a difference of 21.5%.
Associate's Degree Correlation Summary
| Measurement | Immigrants from Dominica | Immigrants from Morocco |
| Minimum | 16.7% | 20.4% |
| Maximum | 78.8% | 79.9% |
| Range | 62.1% | 59.4% |
| Mean | 40.0% | 46.6% |
| Median | 38.9% | 49.4% |
| Interquartile 25% (IQ1) | 34.4% | 39.4% |
| Interquartile 75% (IQ3) | 44.3% | 52.8% |
| Interquartile Range (IQR) | 9.9% | 13.4% |
| Standard Deviation (Sample) | 10.3% | 12.5% |
| Standard Deviation (Population) | 10.2% | 12.3% |
Similar Demographics by Associate's Degree
Demographics Similar to Immigrants from Dominica by Associate's Degree
In terms of associate's degree, the demographic groups most similar to Immigrants from Dominica are Puget Sound Salish (40.5%, a difference of 0.14%), Potawatomi (40.4%, a difference of 0.14%), Puerto Rican (40.4%, a difference of 0.25%), Blackfeet (40.3%, a difference of 0.30%), and Belizean (40.6%, a difference of 0.43%).
| Demographics | Rating | Rank | Associate's Degree |
| Hawaiians | 0.2 /100 | #267 | Tragic 40.9% |
| Central American Indians | 0.2 /100 | #268 | Tragic 40.8% |
| Americans | 0.2 /100 | #269 | Tragic 40.8% |
| Chippewa | 0.2 /100 | #270 | Tragic 40.7% |
| Immigrants | Laos | 0.1 /100 | #271 | Tragic 40.7% |
| Belizeans | 0.1 /100 | #272 | Tragic 40.6% |
| Puget Sound Salish | 0.1 /100 | #273 | Tragic 40.5% |
| Immigrants | Dominica | 0.1 /100 | #274 | Tragic 40.5% |
| Potawatomi | 0.1 /100 | #275 | Tragic 40.4% |
| Puerto Ricans | 0.1 /100 | #276 | Tragic 40.4% |
| Blackfeet | 0.1 /100 | #277 | Tragic 40.3% |
| Ottawa | 0.1 /100 | #278 | Tragic 40.3% |
| Immigrants | Nicaragua | 0.1 /100 | #279 | Tragic 40.3% |
| Immigrants | Micronesia | 0.1 /100 | #280 | Tragic 40.2% |
| Immigrants | Portugal | 0.1 /100 | #281 | Tragic 40.1% |
Demographics Similar to Immigrants from Morocco by Associate's Degree
In terms of associate's degree, the demographic groups most similar to Immigrants from Morocco are Jordanian (49.2%, a difference of 0.13%), Syrian (49.3%, a difference of 0.20%), Austrian (49.1%, a difference of 0.22%), Croatian (49.3%, a difference of 0.23%), and Immigrants from Italy (49.3%, a difference of 0.23%).
| Demographics | Rating | Rank | Associate's Degree |
| Chileans | 97.3 /100 | #102 | Exceptional 49.4% |
| Ukrainians | 97.1 /100 | #103 | Exceptional 49.4% |
| Venezuelans | 97.0 /100 | #104 | Exceptional 49.4% |
| Croatians | 96.8 /100 | #105 | Exceptional 49.3% |
| Immigrants | Italy | 96.7 /100 | #106 | Exceptional 49.3% |
| Syrians | 96.7 /100 | #107 | Exceptional 49.3% |
| Jordanians | 96.6 /100 | #108 | Exceptional 49.2% |
| Immigrants | Morocco | 96.3 /100 | #109 | Exceptional 49.2% |
| Austrians | 95.8 /100 | #110 | Exceptional 49.1% |
| Immigrants | Venezuela | 95.8 /100 | #111 | Exceptional 49.1% |
| Immigrants | Chile | 95.3 /100 | #112 | Exceptional 49.0% |
| Palestinians | 95.3 /100 | #113 | Exceptional 49.0% |
| Arabs | 95.3 /100 | #114 | Exceptional 49.0% |
| Luxembourgers | 95.1 /100 | #115 | Exceptional 48.9% |
| British | 95.0 /100 | #116 | Exceptional 48.9% |