Irish vs Immigrants from Morocco Associate's Degree
COMPARE
Irish
Immigrants from Morocco
Associate's Degree
Associate's Degree Comparison
Irish
Immigrants from Morocco
46.5%
ASSOCIATE'S DEGREE
53.6/ 100
METRIC RATING
170th/ 347
METRIC RANK
49.2%
ASSOCIATE'S DEGREE
96.3/ 100
METRIC RATING
109th/ 347
METRIC RANK
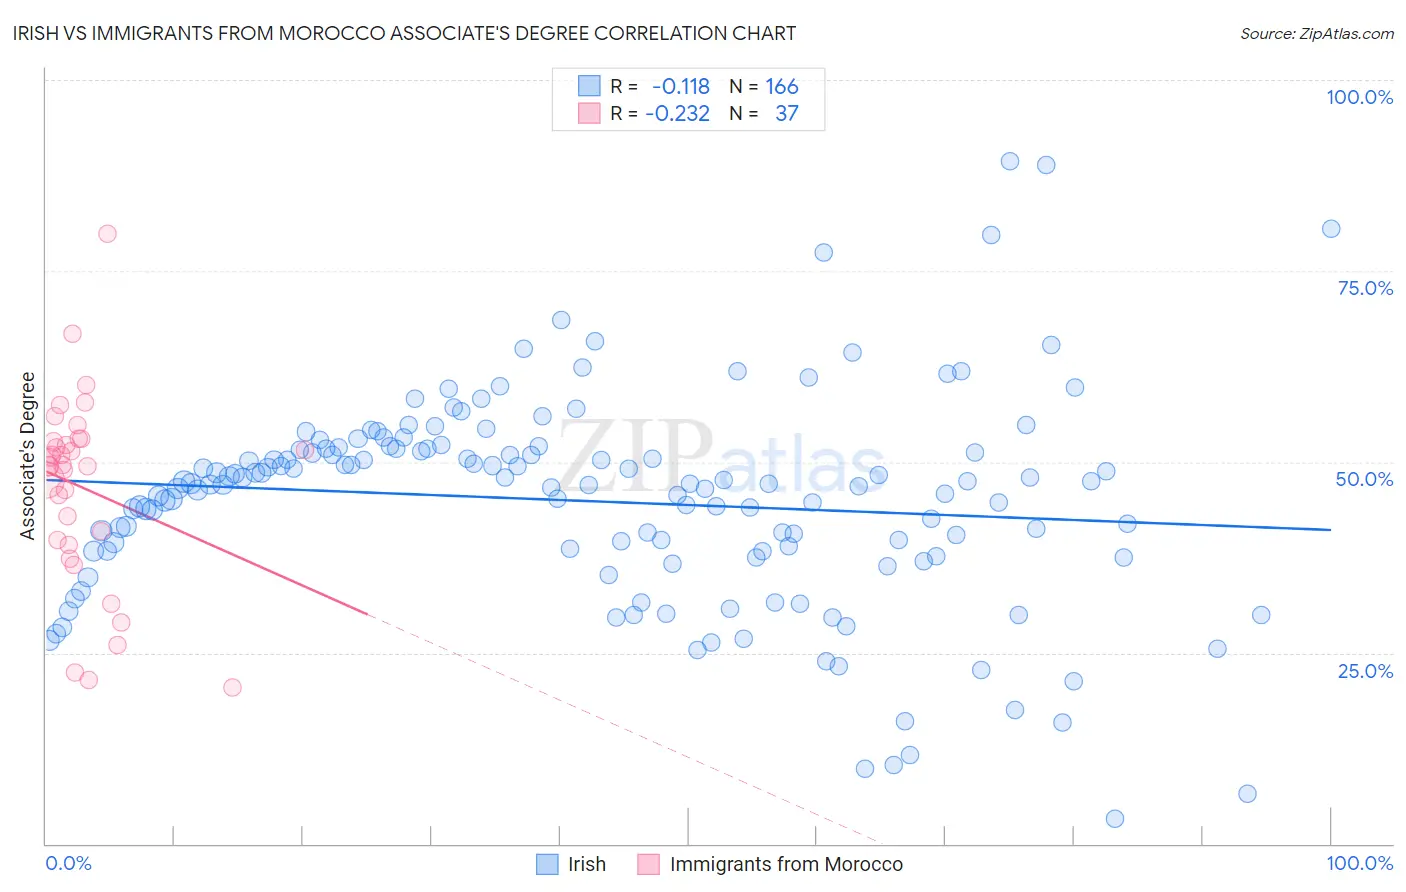
Irish vs Immigrants from Morocco Associate's Degree Correlation Chart
The statistical analysis conducted on geographies consisting of 580,555,022 people shows a poor negative correlation between the proportion of Irish and percentage of population with at least associate's degree education in the United States with a correlation coefficient (R) of -0.118 and weighted average of 46.5%. Similarly, the statistical analysis conducted on geographies consisting of 178,912,438 people shows a weak negative correlation between the proportion of Immigrants from Morocco and percentage of population with at least associate's degree education in the United States with a correlation coefficient (R) of -0.232 and weighted average of 49.2%, a difference of 5.8%.
Associate's Degree Correlation Summary
| Measurement | Irish | Immigrants from Morocco |
| Minimum | 3.2% | 20.4% |
| Maximum | 89.4% | 79.9% |
| Range | 86.2% | 59.4% |
| Mean | 44.9% | 46.6% |
| Median | 47.1% | 49.4% |
| Interquartile 25% (IQ1) | 38.3% | 39.4% |
| Interquartile 75% (IQ3) | 51.7% | 52.8% |
| Interquartile Range (IQR) | 13.4% | 13.4% |
| Standard Deviation (Sample) | 13.9% | 12.5% |
| Standard Deviation (Population) | 13.9% | 12.3% |
Similar Demographics by Associate's Degree
Demographics Similar to Irish by Associate's Degree
In terms of associate's degree, the demographic groups most similar to Irish are Basque (46.5%, a difference of 0.060%), Uruguayan (46.5%, a difference of 0.13%), Immigrants from Somalia (46.5%, a difference of 0.14%), Peruvian (46.4%, a difference of 0.24%), and Immigrants from Iraq (46.4%, a difference of 0.25%).
| Demographics | Rating | Rank | Associate's Degree |
| Somalis | 62.5 /100 | #163 | Good 46.8% |
| Colombians | 62.4 /100 | #164 | Good 46.8% |
| Immigrants | South America | 59.9 /100 | #165 | Average 46.7% |
| Hungarians | 59.3 /100 | #166 | Average 46.7% |
| Immigrants | Sierra Leone | 59.2 /100 | #167 | Average 46.7% |
| Immigrants | Somalia | 55.5 /100 | #168 | Average 46.5% |
| Uruguayans | 55.4 /100 | #169 | Average 46.5% |
| Irish | 53.6 /100 | #170 | Average 46.5% |
| Basques | 52.8 /100 | #171 | Average 46.5% |
| Peruvians | 50.5 /100 | #172 | Average 46.4% |
| Immigrants | Iraq | 50.3 /100 | #173 | Average 46.4% |
| English | 50.0 /100 | #174 | Average 46.4% |
| Belgians | 48.9 /100 | #175 | Average 46.3% |
| Finns | 48.5 /100 | #176 | Average 46.3% |
| Slovaks | 48.4 /100 | #177 | Average 46.3% |
Demographics Similar to Immigrants from Morocco by Associate's Degree
In terms of associate's degree, the demographic groups most similar to Immigrants from Morocco are Jordanian (49.2%, a difference of 0.13%), Syrian (49.3%, a difference of 0.20%), Austrian (49.1%, a difference of 0.22%), Croatian (49.3%, a difference of 0.23%), and Immigrants from Italy (49.3%, a difference of 0.23%).
| Demographics | Rating | Rank | Associate's Degree |
| Chileans | 97.3 /100 | #102 | Exceptional 49.4% |
| Ukrainians | 97.1 /100 | #103 | Exceptional 49.4% |
| Venezuelans | 97.0 /100 | #104 | Exceptional 49.4% |
| Croatians | 96.8 /100 | #105 | Exceptional 49.3% |
| Immigrants | Italy | 96.7 /100 | #106 | Exceptional 49.3% |
| Syrians | 96.7 /100 | #107 | Exceptional 49.3% |
| Jordanians | 96.6 /100 | #108 | Exceptional 49.2% |
| Immigrants | Morocco | 96.3 /100 | #109 | Exceptional 49.2% |
| Austrians | 95.8 /100 | #110 | Exceptional 49.1% |
| Immigrants | Venezuela | 95.8 /100 | #111 | Exceptional 49.1% |
| Immigrants | Chile | 95.3 /100 | #112 | Exceptional 49.0% |
| Palestinians | 95.3 /100 | #113 | Exceptional 49.0% |
| Arabs | 95.3 /100 | #114 | Exceptional 49.0% |
| Luxembourgers | 95.1 /100 | #115 | Exceptional 48.9% |
| British | 95.0 /100 | #116 | Exceptional 48.9% |