West Indian vs Immigrants from Korea Bachelor's Degree
COMPARE
West Indian
Immigrants from Korea
Bachelor's Degree
Bachelor's Degree Comparison
West Indians
Immigrants from Korea
35.8%
BACHELOR'S DEGREE
9.7/ 100
METRIC RATING
219th/ 347
METRIC RANK
47.0%
BACHELOR'S DEGREE
100.0/ 100
METRIC RATING
24th/ 347
METRIC RANK
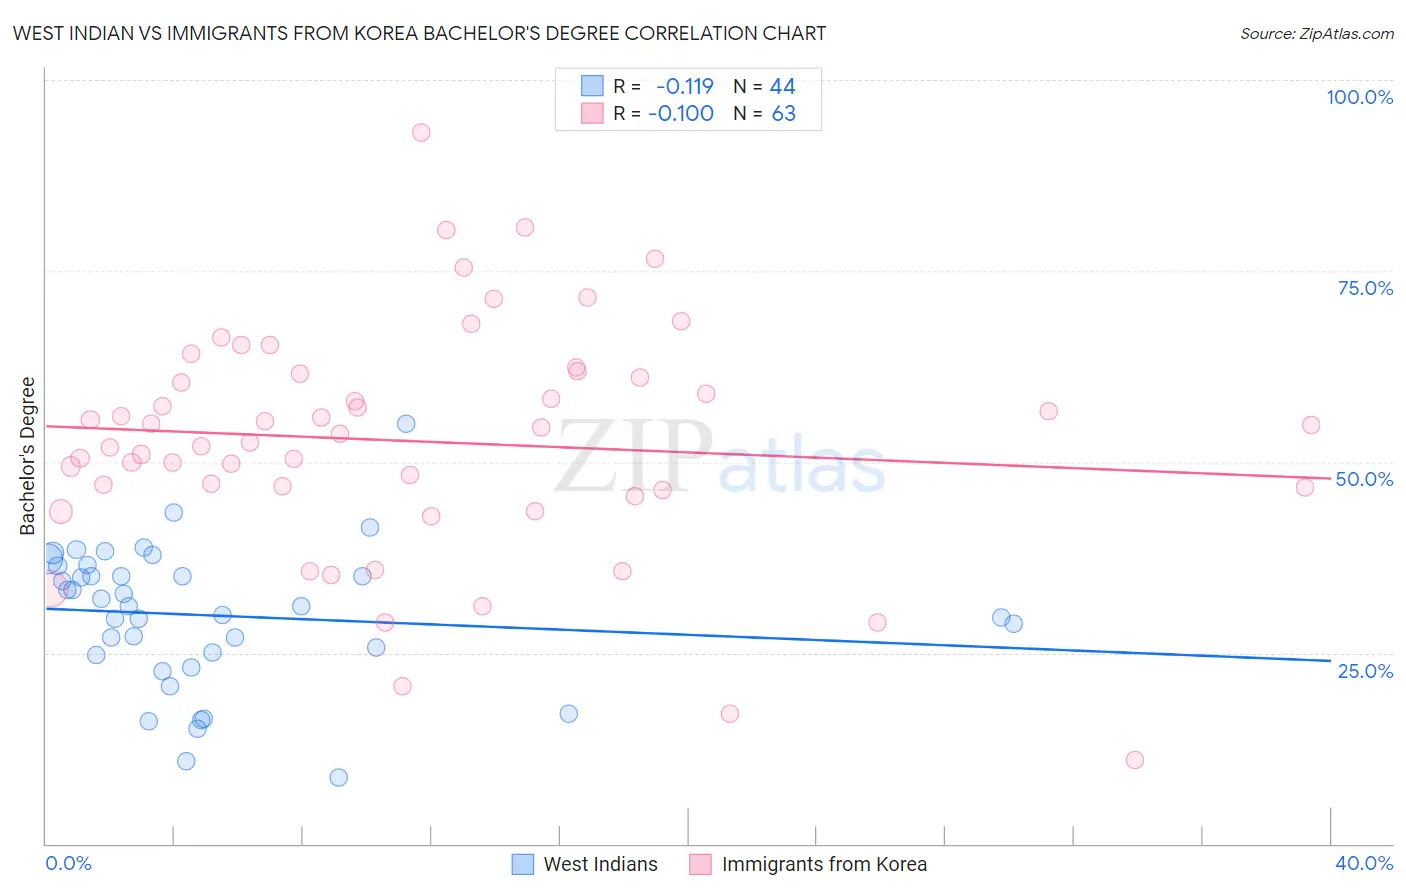
West Indian vs Immigrants from Korea Bachelor's Degree Correlation Chart
The statistical analysis conducted on geographies consisting of 254,052,702 people shows a poor negative correlation between the proportion of West Indians and percentage of population with at least bachelor's degree education in the United States with a correlation coefficient (R) of -0.119 and weighted average of 35.8%. Similarly, the statistical analysis conducted on geographies consisting of 416,289,272 people shows a slight negative correlation between the proportion of Immigrants from Korea and percentage of population with at least bachelor's degree education in the United States with a correlation coefficient (R) of -0.100 and weighted average of 47.0%, a difference of 31.3%.
Bachelor's Degree Correlation Summary
| Measurement | West Indian | Immigrants from Korea |
| Minimum | 8.6% | 10.9% |
| Maximum | 54.9% | 93.1% |
| Range | 46.3% | 82.2% |
| Mean | 29.9% | 52.7% |
| Median | 31.1% | 53.7% |
| Interquartile 25% (IQ1) | 24.9% | 46.3% |
| Interquartile 75% (IQ3) | 35.7% | 61.5% |
| Interquartile Range (IQR) | 10.9% | 15.2% |
| Standard Deviation (Sample) | 9.2% | 15.3% |
| Standard Deviation (Population) | 9.1% | 15.1% |
Similar Demographics by Bachelor's Degree
Demographics Similar to West Indians by Bachelor's Degree
In terms of bachelor's degree, the demographic groups most similar to West Indians are Subsaharan African (35.8%, a difference of 0.030%), Spanish (35.8%, a difference of 0.040%), German Russian (35.8%, a difference of 0.13%), Dutch (35.7%, a difference of 0.15%), and Trinidadian and Tobagonian (35.7%, a difference of 0.29%).
| Demographics | Rating | Rank | Bachelor's Degree |
| Immigrants | Philippines | 17.8 /100 | #212 | Poor 36.4% |
| Immigrants | Panama | 14.2 /100 | #213 | Poor 36.2% |
| Germans | 13.9 /100 | #214 | Poor 36.1% |
| Immigrants | Western Africa | 13.8 /100 | #215 | Poor 36.1% |
| Barbadians | 13.5 /100 | #216 | Poor 36.1% |
| German Russians | 10.2 /100 | #217 | Poor 35.8% |
| Sub-Saharan Africans | 9.8 /100 | #218 | Tragic 35.8% |
| West Indians | 9.7 /100 | #219 | Tragic 35.8% |
| Spanish | 9.6 /100 | #220 | Tragic 35.8% |
| Dutch | 9.2 /100 | #221 | Tragic 35.7% |
| Trinidadians and Tobagonians | 8.8 /100 | #222 | Tragic 35.7% |
| French Canadians | 8.3 /100 | #223 | Tragic 35.6% |
| Immigrants | Barbados | 7.5 /100 | #224 | Tragic 35.5% |
| Immigrants | Burma/Myanmar | 7.3 /100 | #225 | Tragic 35.5% |
| Portuguese | 7.2 /100 | #226 | Tragic 35.5% |
Demographics Similar to Immigrants from Korea by Bachelor's Degree
In terms of bachelor's degree, the demographic groups most similar to Immigrants from Korea are Immigrants from Sweden (47.0%, a difference of 0.040%), Immigrants from Belgium (47.0%, a difference of 0.13%), Burmese (46.9%, a difference of 0.22%), Immigrants from Ireland (47.1%, a difference of 0.33%), and Immigrants from Japan (46.8%, a difference of 0.33%).
| Demographics | Rating | Rank | Bachelor's Degree |
| Eastern Europeans | 100.0 /100 | #17 | Exceptional 47.5% |
| Indians (Asian) | 100.0 /100 | #18 | Exceptional 47.4% |
| Cambodians | 100.0 /100 | #19 | Exceptional 47.2% |
| Immigrants | Switzerland | 100.0 /100 | #20 | Exceptional 47.1% |
| Immigrants | Ireland | 100.0 /100 | #21 | Exceptional 47.1% |
| Immigrants | Belgium | 100.0 /100 | #22 | Exceptional 47.0% |
| Immigrants | Sweden | 100.0 /100 | #23 | Exceptional 47.0% |
| Immigrants | Korea | 100.0 /100 | #24 | Exceptional 47.0% |
| Burmese | 100.0 /100 | #25 | Exceptional 46.9% |
| Immigrants | Japan | 100.0 /100 | #26 | Exceptional 46.8% |
| Immigrants | France | 100.0 /100 | #27 | Exceptional 46.4% |
| Turks | 100.0 /100 | #28 | Exceptional 46.2% |
| Israelis | 100.0 /100 | #29 | Exceptional 46.1% |
| Immigrants | Sri Lanka | 100.0 /100 | #30 | Exceptional 46.1% |
| Latvians | 100.0 /100 | #31 | Exceptional 46.1% |