Lithuanian vs Dutch Professional Degree
COMPARE
Lithuanian
Dutch
Professional Degree
Professional Degree Comparison
Lithuanians
Dutch
5.4%
PROFESSIONAL DEGREE
99.8/ 100
METRIC RATING
72nd/ 347
METRIC RANK
4.0%
PROFESSIONAL DEGREE
9.0/ 100
METRIC RATING
218th/ 347
METRIC RANK
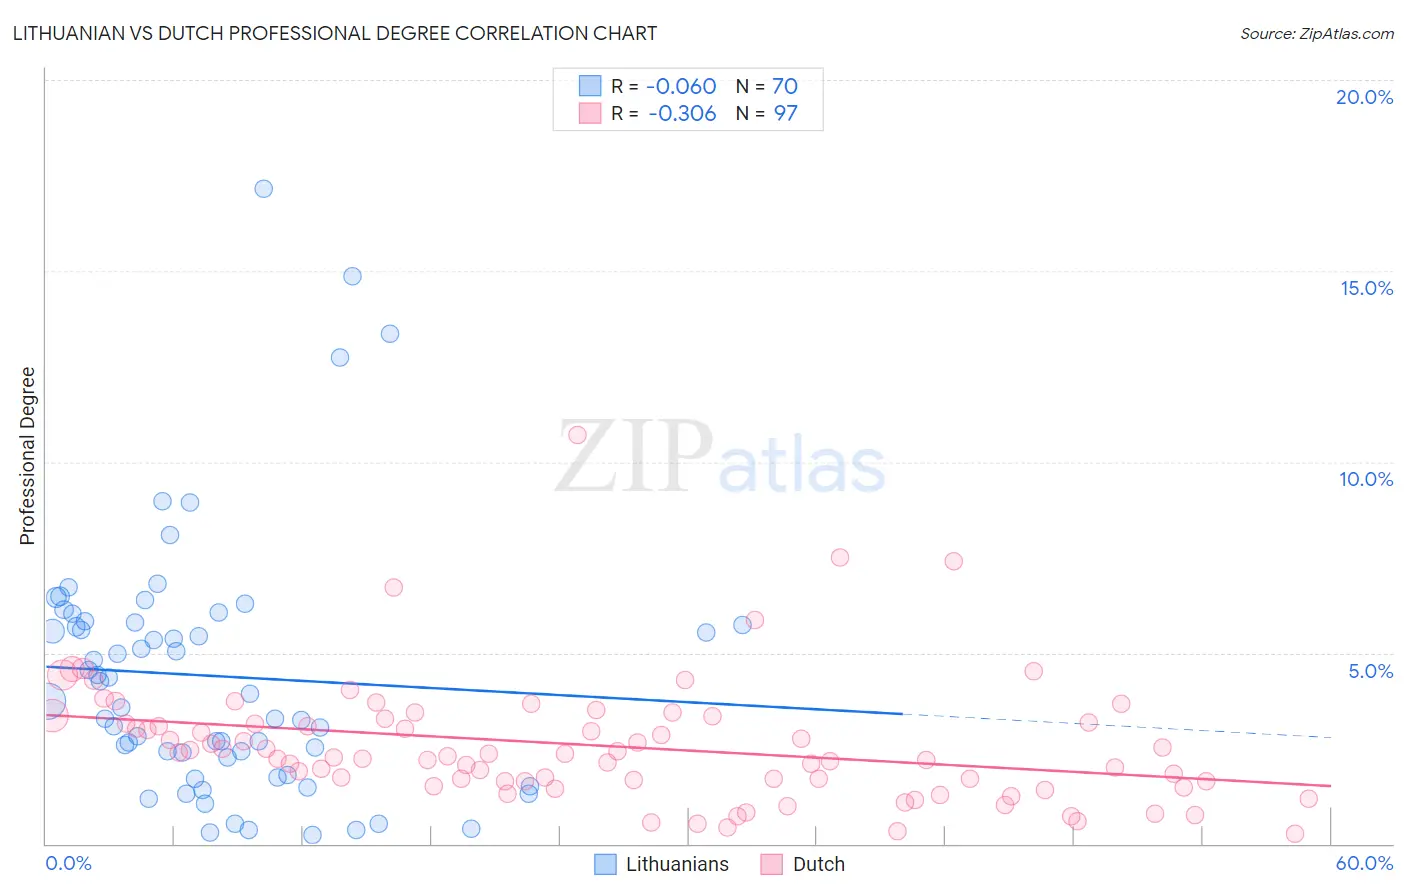
Lithuanian vs Dutch Professional Degree Correlation Chart
The statistical analysis conducted on geographies consisting of 420,702,228 people shows a slight negative correlation between the proportion of Lithuanians and percentage of population with at least professional degree education in the United States with a correlation coefficient (R) of -0.060 and weighted average of 5.4%. Similarly, the statistical analysis conducted on geographies consisting of 547,430,412 people shows a mild negative correlation between the proportion of Dutch and percentage of population with at least professional degree education in the United States with a correlation coefficient (R) of -0.306 and weighted average of 4.0%, a difference of 33.4%.
Professional Degree Correlation Summary
| Measurement | Lithuanian | Dutch |
| Minimum | 0.24% | 0.26% |
| Maximum | 17.2% | 10.7% |
| Range | 16.9% | 10.4% |
| Mean | 4.4% | 2.6% |
| Median | 3.8% | 2.3% |
| Interquartile 25% (IQ1) | 2.3% | 1.6% |
| Interquartile 75% (IQ3) | 5.8% | 3.2% |
| Interquartile Range (IQR) | 3.5% | 1.6% |
| Standard Deviation (Sample) | 3.4% | 1.6% |
| Standard Deviation (Population) | 3.3% | 1.6% |
Similar Demographics by Professional Degree
Demographics Similar to Lithuanians by Professional Degree
In terms of professional degree, the demographic groups most similar to Lithuanians are Immigrants from Romania (5.4%, a difference of 0.10%), Ethiopian (5.4%, a difference of 0.47%), Immigrants from Western Asia (5.4%, a difference of 0.48%), Immigrants from Indonesia (5.3%, a difference of 0.61%), and Immigrants from Canada (5.3%, a difference of 0.69%).
| Demographics | Rating | Rank | Professional Degree |
| Immigrants | Bolivia | 99.9 /100 | #65 | Exceptional 5.5% |
| Immigrants | Kazakhstan | 99.9 /100 | #66 | Exceptional 5.5% |
| Immigrants | Bulgaria | 99.9 /100 | #67 | Exceptional 5.5% |
| Immigrants | Lebanon | 99.9 /100 | #68 | Exceptional 5.5% |
| Immigrants | Hungary | 99.9 /100 | #69 | Exceptional 5.5% |
| Bhutanese | 99.8 /100 | #70 | Exceptional 5.4% |
| Immigrants | Western Asia | 99.8 /100 | #71 | Exceptional 5.4% |
| Lithuanians | 99.8 /100 | #72 | Exceptional 5.4% |
| Immigrants | Romania | 99.8 /100 | #73 | Exceptional 5.4% |
| Ethiopians | 99.7 /100 | #74 | Exceptional 5.4% |
| Immigrants | Indonesia | 99.7 /100 | #75 | Exceptional 5.3% |
| Immigrants | Canada | 99.7 /100 | #76 | Exceptional 5.3% |
| Immigrants | Ethiopia | 99.7 /100 | #77 | Exceptional 5.3% |
| Armenians | 99.7 /100 | #78 | Exceptional 5.3% |
| Immigrants | North America | 99.7 /100 | #79 | Exceptional 5.3% |
Demographics Similar to Dutch by Professional Degree
In terms of professional degree, the demographic groups most similar to Dutch are Immigrants from South Eastern Asia (4.0%, a difference of 0.030%), Immigrants from Vietnam (4.0%, a difference of 0.21%), West Indian (4.1%, a difference of 0.37%), Ute (4.0%, a difference of 0.39%), and French Canadian (4.0%, a difference of 0.52%).
| Demographics | Rating | Rank | Professional Degree |
| Germans | 11.6 /100 | #211 | Poor 4.1% |
| Whites/Caucasians | 11.2 /100 | #212 | Poor 4.1% |
| Koreans | 10.7 /100 | #213 | Poor 4.1% |
| Immigrants | Ghana | 10.6 /100 | #214 | Poor 4.1% |
| Portuguese | 10.5 /100 | #215 | Poor 4.1% |
| West Indians | 9.8 /100 | #216 | Tragic 4.1% |
| Immigrants | Vietnam | 9.4 /100 | #217 | Tragic 4.0% |
| Dutch | 9.0 /100 | #218 | Tragic 4.0% |
| Immigrants | South Eastern Asia | 8.9 /100 | #219 | Tragic 4.0% |
| Ute | 8.2 /100 | #220 | Tragic 4.0% |
| French Canadians | 8.0 /100 | #221 | Tragic 4.0% |
| Immigrants | Western Africa | 7.5 /100 | #222 | Tragic 4.0% |
| Immigrants | Bosnia and Herzegovina | 7.4 /100 | #223 | Tragic 4.0% |
| Trinidadians and Tobagonians | 7.1 /100 | #224 | Tragic 4.0% |
| Tlingit-Haida | 6.9 /100 | #225 | Tragic 4.0% |