Lithuanian vs Immigrants from Spain Professional Degree
COMPARE
Lithuanian
Immigrants from Spain
Professional Degree
Professional Degree Comparison
Lithuanians
Immigrants from Spain
5.4%
PROFESSIONAL DEGREE
99.8/ 100
METRIC RATING
72nd/ 347
METRIC RANK
6.3%
PROFESSIONAL DEGREE
100.0/ 100
METRIC RATING
24th/ 347
METRIC RANK
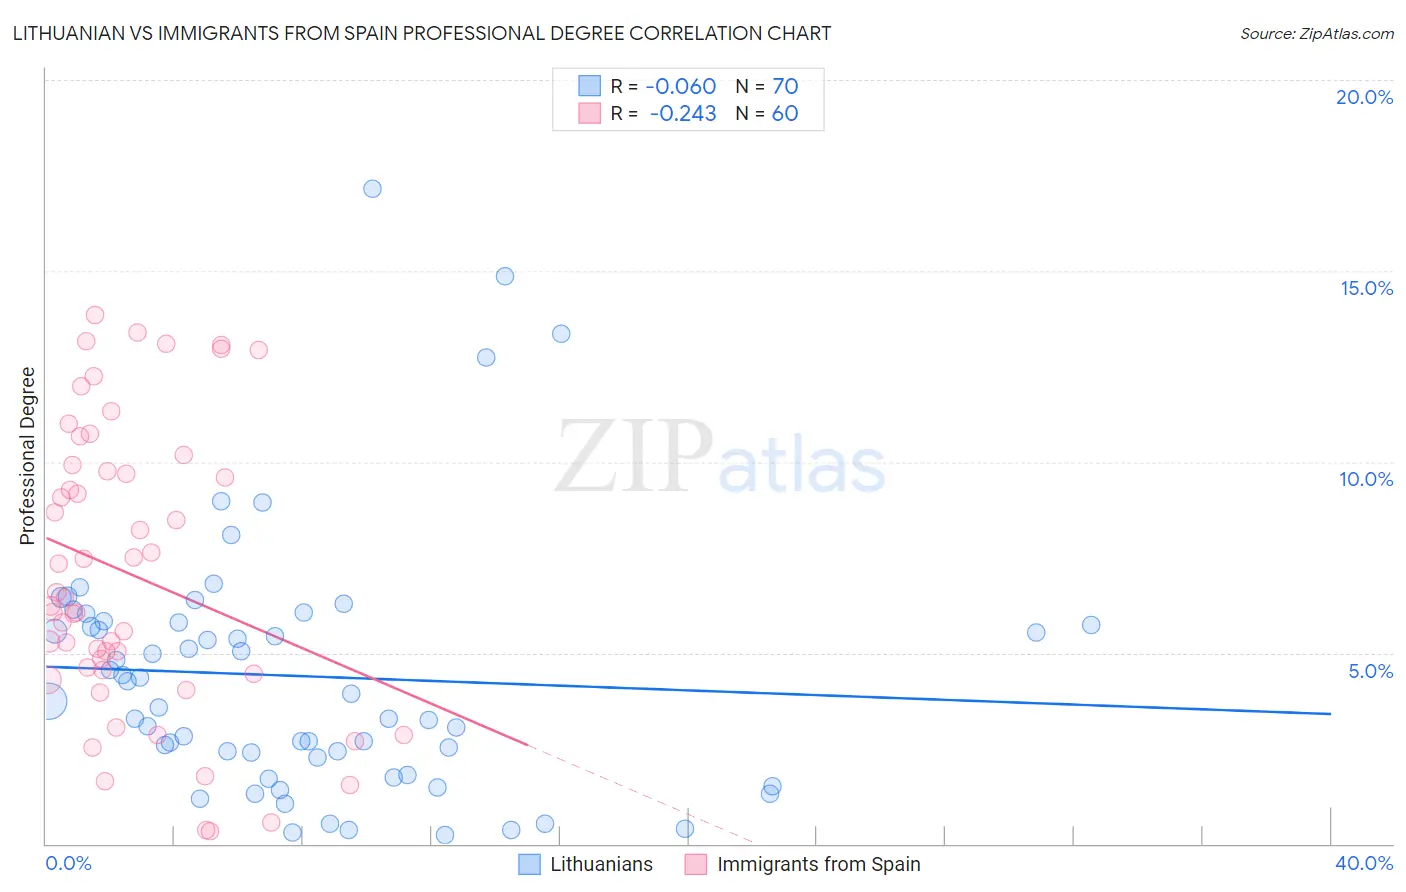
Lithuanian vs Immigrants from Spain Professional Degree Correlation Chart
The statistical analysis conducted on geographies consisting of 420,702,228 people shows a slight negative correlation between the proportion of Lithuanians and percentage of population with at least professional degree education in the United States with a correlation coefficient (R) of -0.060 and weighted average of 5.4%. Similarly, the statistical analysis conducted on geographies consisting of 239,491,519 people shows a weak negative correlation between the proportion of Immigrants from Spain and percentage of population with at least professional degree education in the United States with a correlation coefficient (R) of -0.243 and weighted average of 6.3%, a difference of 17.6%.
Professional Degree Correlation Summary
| Measurement | Lithuanian | Immigrants from Spain |
| Minimum | 0.24% | 0.34% |
| Maximum | 17.2% | 13.8% |
| Range | 16.9% | 13.5% |
| Mean | 4.4% | 7.0% |
| Median | 3.8% | 6.3% |
| Interquartile 25% (IQ1) | 2.3% | 4.5% |
| Interquartile 75% (IQ3) | 5.8% | 9.8% |
| Interquartile Range (IQR) | 3.5% | 5.3% |
| Standard Deviation (Sample) | 3.4% | 3.7% |
| Standard Deviation (Population) | 3.3% | 3.7% |
Similar Demographics by Professional Degree
Demographics Similar to Lithuanians by Professional Degree
In terms of professional degree, the demographic groups most similar to Lithuanians are Immigrants from Romania (5.4%, a difference of 0.10%), Ethiopian (5.4%, a difference of 0.47%), Immigrants from Western Asia (5.4%, a difference of 0.48%), Immigrants from Indonesia (5.3%, a difference of 0.61%), and Immigrants from Canada (5.3%, a difference of 0.69%).
| Demographics | Rating | Rank | Professional Degree |
| Immigrants | Bolivia | 99.9 /100 | #65 | Exceptional 5.5% |
| Immigrants | Kazakhstan | 99.9 /100 | #66 | Exceptional 5.5% |
| Immigrants | Bulgaria | 99.9 /100 | #67 | Exceptional 5.5% |
| Immigrants | Lebanon | 99.9 /100 | #68 | Exceptional 5.5% |
| Immigrants | Hungary | 99.9 /100 | #69 | Exceptional 5.5% |
| Bhutanese | 99.8 /100 | #70 | Exceptional 5.4% |
| Immigrants | Western Asia | 99.8 /100 | #71 | Exceptional 5.4% |
| Lithuanians | 99.8 /100 | #72 | Exceptional 5.4% |
| Immigrants | Romania | 99.8 /100 | #73 | Exceptional 5.4% |
| Ethiopians | 99.7 /100 | #74 | Exceptional 5.4% |
| Immigrants | Indonesia | 99.7 /100 | #75 | Exceptional 5.3% |
| Immigrants | Canada | 99.7 /100 | #76 | Exceptional 5.3% |
| Immigrants | Ethiopia | 99.7 /100 | #77 | Exceptional 5.3% |
| Armenians | 99.7 /100 | #78 | Exceptional 5.3% |
| Immigrants | North America | 99.7 /100 | #79 | Exceptional 5.3% |
Demographics Similar to Immigrants from Spain by Professional Degree
In terms of professional degree, the demographic groups most similar to Immigrants from Spain are Russian (6.3%, a difference of 0.040%), Immigrants from Ireland (6.3%, a difference of 0.49%), Immigrants from Japan (6.4%, a difference of 0.51%), Immigrants from Hong Kong (6.4%, a difference of 1.3%), and Latvian (6.2%, a difference of 1.4%).
| Demographics | Rating | Rank | Professional Degree |
| Immigrants | Eastern Asia | 100.0 /100 | #17 | Exceptional 6.6% |
| Soviet Union | 100.0 /100 | #18 | Exceptional 6.6% |
| Indians (Asian) | 100.0 /100 | #19 | Exceptional 6.5% |
| Immigrants | Denmark | 100.0 /100 | #20 | Exceptional 6.4% |
| Immigrants | Hong Kong | 100.0 /100 | #21 | Exceptional 6.4% |
| Immigrants | Japan | 100.0 /100 | #22 | Exceptional 6.4% |
| Russians | 100.0 /100 | #23 | Exceptional 6.3% |
| Immigrants | Spain | 100.0 /100 | #24 | Exceptional 6.3% |
| Immigrants | Ireland | 100.0 /100 | #25 | Exceptional 6.3% |
| Latvians | 100.0 /100 | #26 | Exceptional 6.2% |
| Immigrants | Northern Europe | 100.0 /100 | #27 | Exceptional 6.2% |
| Turks | 100.0 /100 | #28 | Exceptional 6.2% |
| Immigrants | Sri Lanka | 100.0 /100 | #29 | Exceptional 6.2% |
| Immigrants | Turkey | 100.0 /100 | #30 | Exceptional 6.2% |
| Immigrants | India | 100.0 /100 | #31 | Exceptional 6.2% |