Northern European vs Immigrants from Barbados Professional Degree
COMPARE
Northern European
Immigrants from Barbados
Professional Degree
Professional Degree Comparison
Northern Europeans
Immigrants from Barbados
5.2%
PROFESSIONAL DEGREE
99.3/ 100
METRIC RATING
93rd/ 347
METRIC RANK
3.9%
PROFESSIONAL DEGREE
4.0/ 100
METRIC RATING
235th/ 347
METRIC RANK
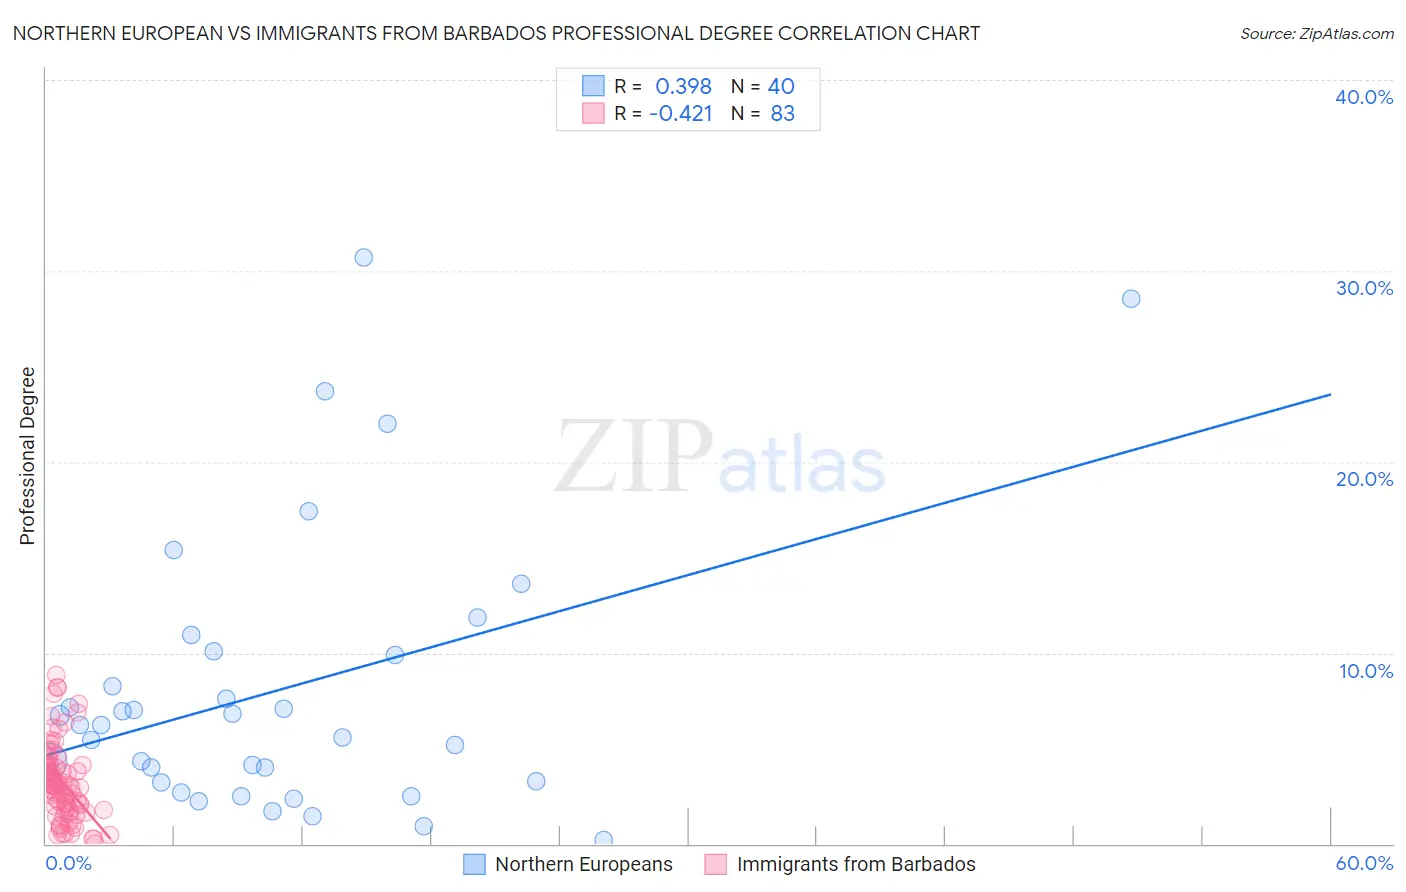
Northern European vs Immigrants from Barbados Professional Degree Correlation Chart
The statistical analysis conducted on geographies consisting of 405,045,540 people shows a mild positive correlation between the proportion of Northern Europeans and percentage of population with at least professional degree education in the United States with a correlation coefficient (R) of 0.398 and weighted average of 5.2%. Similarly, the statistical analysis conducted on geographies consisting of 112,711,705 people shows a moderate negative correlation between the proportion of Immigrants from Barbados and percentage of population with at least professional degree education in the United States with a correlation coefficient (R) of -0.421 and weighted average of 3.9%, a difference of 33.6%.
Professional Degree Correlation Summary
| Measurement | Northern European | Immigrants from Barbados |
| Minimum | 0.22% | 0.017% |
| Maximum | 30.7% | 8.9% |
| Range | 30.5% | 8.8% |
| Mean | 8.1% | 3.2% |
| Median | 6.2% | 3.0% |
| Interquartile 25% (IQ1) | 3.2% | 1.7% |
| Interquartile 75% (IQ3) | 10.0% | 4.1% |
| Interquartile Range (IQR) | 6.7% | 2.4% |
| Standard Deviation (Sample) | 7.3% | 2.0% |
| Standard Deviation (Population) | 7.2% | 2.0% |
Similar Demographics by Professional Degree
Demographics Similar to Northern Europeans by Professional Degree
In terms of professional degree, the demographic groups most similar to Northern Europeans are Alsatian (5.2%, a difference of 0.020%), Zimbabwean (5.2%, a difference of 0.20%), Immigrants from Uzbekistan (5.2%, a difference of 0.61%), Immigrants from Eastern Europe (5.2%, a difference of 0.65%), and Laotian (5.2%, a difference of 0.68%).
| Demographics | Rating | Rank | Professional Degree |
| Greeks | 99.6 /100 | #86 | Exceptional 5.3% |
| Immigrants | Chile | 99.5 /100 | #87 | Exceptional 5.3% |
| Egyptians | 99.5 /100 | #88 | Exceptional 5.3% |
| Chileans | 99.5 /100 | #89 | Exceptional 5.3% |
| Immigrants | Scotland | 99.5 /100 | #90 | Exceptional 5.3% |
| Laotians | 99.5 /100 | #91 | Exceptional 5.2% |
| Immigrants | Eastern Europe | 99.5 /100 | #92 | Exceptional 5.2% |
| Northern Europeans | 99.3 /100 | #93 | Exceptional 5.2% |
| Alsatians | 99.3 /100 | #94 | Exceptional 5.2% |
| Zimbabweans | 99.3 /100 | #95 | Exceptional 5.2% |
| Immigrants | Uzbekistan | 99.2 /100 | #96 | Exceptional 5.2% |
| Syrians | 99.1 /100 | #97 | Exceptional 5.2% |
| Austrians | 99.1 /100 | #98 | Exceptional 5.2% |
| Immigrants | Italy | 99.1 /100 | #99 | Exceptional 5.2% |
| Ugandans | 98.8 /100 | #100 | Exceptional 5.1% |
Demographics Similar to Immigrants from Barbados by Professional Degree
In terms of professional degree, the demographic groups most similar to Immigrants from Barbados are Nonimmigrants (3.9%, a difference of 0.010%), Immigrants from Philippines (3.9%, a difference of 0.050%), Spanish American (3.9%, a difference of 0.22%), Immigrants from Trinidad and Tobago (3.9%, a difference of 0.29%), and Cree (3.9%, a difference of 0.31%).
| Demographics | Rating | Rank | Professional Degree |
| Immigrants | West Indies | 5.6 /100 | #228 | Tragic 4.0% |
| Immigrants | Burma/Myanmar | 5.4 /100 | #229 | Tragic 3.9% |
| Nicaraguans | 5.1 /100 | #230 | Tragic 3.9% |
| Ecuadorians | 4.6 /100 | #231 | Tragic 3.9% |
| Cree | 4.3 /100 | #232 | Tragic 3.9% |
| Immigrants | Philippines | 4.1 /100 | #233 | Tragic 3.9% |
| Immigrants | Nonimmigrants | 4.0 /100 | #234 | Tragic 3.9% |
| Immigrants | Barbados | 4.0 /100 | #235 | Tragic 3.9% |
| Spanish Americans | 3.8 /100 | #236 | Tragic 3.9% |
| Immigrants | Trinidad and Tobago | 3.8 /100 | #237 | Tragic 3.9% |
| Colville | 2.6 /100 | #238 | Tragic 3.8% |
| British West Indians | 2.4 /100 | #239 | Tragic 3.8% |
| Immigrants | Ecuador | 2.3 /100 | #240 | Tragic 3.8% |
| Alaskan Athabascans | 2.3 /100 | #241 | Tragic 3.8% |
| Native Hawaiians | 2.3 /100 | #242 | Tragic 3.8% |