Lithuanian vs Immigrants from Costa Rica Professional Degree
COMPARE
Lithuanian
Immigrants from Costa Rica
Professional Degree
Professional Degree Comparison
Lithuanians
Immigrants from Costa Rica
5.4%
PROFESSIONAL DEGREE
99.8/ 100
METRIC RATING
72nd/ 347
METRIC RANK
4.4%
PROFESSIONAL DEGREE
46.7/ 100
METRIC RATING
178th/ 347
METRIC RANK
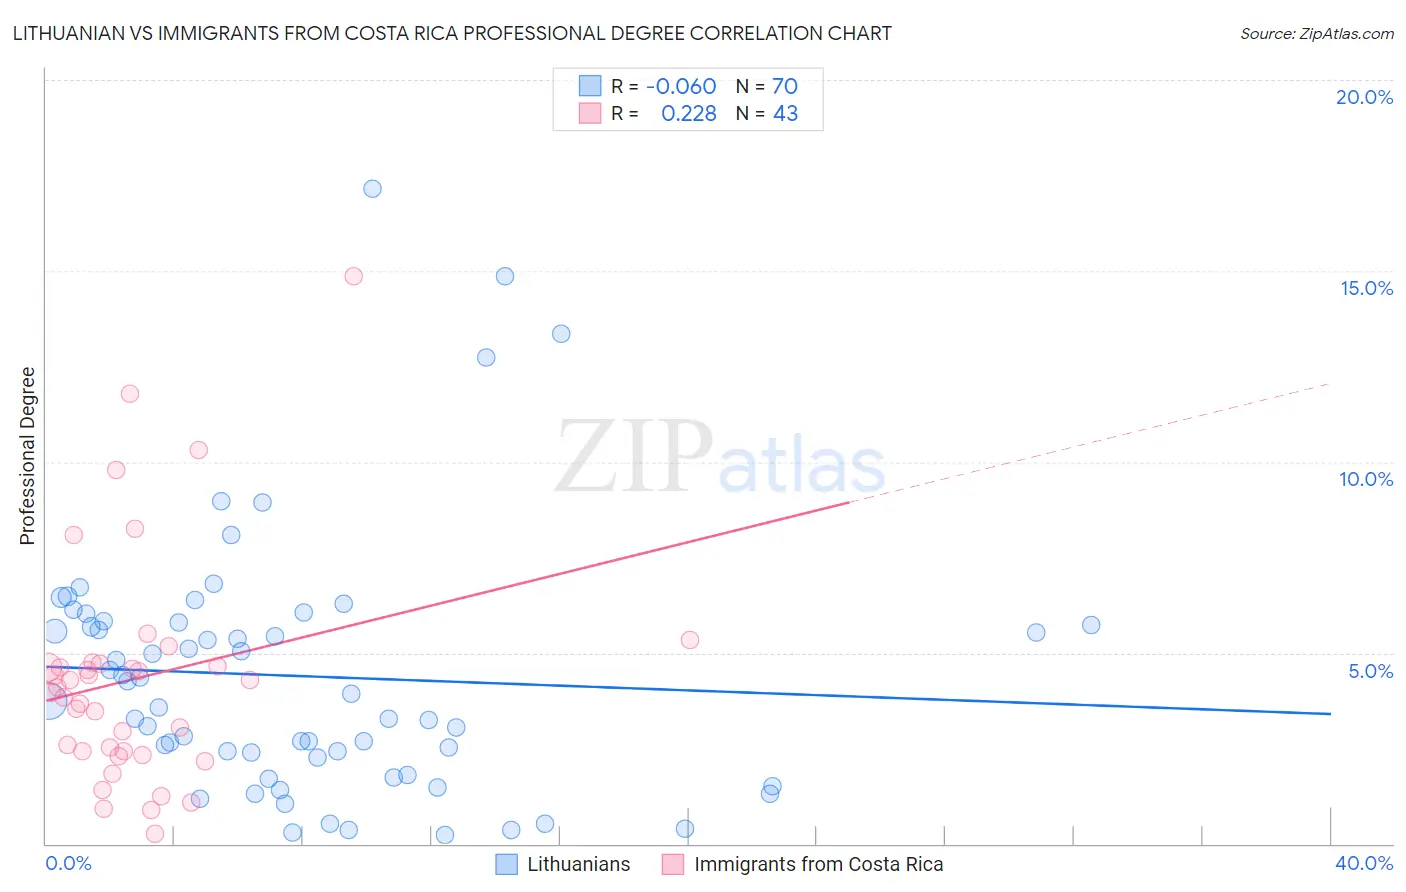
Lithuanian vs Immigrants from Costa Rica Professional Degree Correlation Chart
The statistical analysis conducted on geographies consisting of 420,702,228 people shows a slight negative correlation between the proportion of Lithuanians and percentage of population with at least professional degree education in the United States with a correlation coefficient (R) of -0.060 and weighted average of 5.4%. Similarly, the statistical analysis conducted on geographies consisting of 204,151,669 people shows a weak positive correlation between the proportion of Immigrants from Costa Rica and percentage of population with at least professional degree education in the United States with a correlation coefficient (R) of 0.228 and weighted average of 4.4%, a difference of 22.7%.
Professional Degree Correlation Summary
| Measurement | Lithuanian | Immigrants from Costa Rica |
| Minimum | 0.24% | 0.26% |
| Maximum | 17.2% | 14.9% |
| Range | 16.9% | 14.6% |
| Mean | 4.4% | 4.3% |
| Median | 3.8% | 4.1% |
| Interquartile 25% (IQ1) | 2.3% | 2.4% |
| Interquartile 75% (IQ3) | 5.8% | 4.7% |
| Interquartile Range (IQR) | 3.5% | 2.3% |
| Standard Deviation (Sample) | 3.4% | 3.0% |
| Standard Deviation (Population) | 3.3% | 2.9% |
Similar Demographics by Professional Degree
Demographics Similar to Lithuanians by Professional Degree
In terms of professional degree, the demographic groups most similar to Lithuanians are Immigrants from Romania (5.4%, a difference of 0.10%), Ethiopian (5.4%, a difference of 0.47%), Immigrants from Western Asia (5.4%, a difference of 0.48%), Immigrants from Indonesia (5.3%, a difference of 0.61%), and Immigrants from Canada (5.3%, a difference of 0.69%).
| Demographics | Rating | Rank | Professional Degree |
| Immigrants | Bolivia | 99.9 /100 | #65 | Exceptional 5.5% |
| Immigrants | Kazakhstan | 99.9 /100 | #66 | Exceptional 5.5% |
| Immigrants | Bulgaria | 99.9 /100 | #67 | Exceptional 5.5% |
| Immigrants | Lebanon | 99.9 /100 | #68 | Exceptional 5.5% |
| Immigrants | Hungary | 99.9 /100 | #69 | Exceptional 5.5% |
| Bhutanese | 99.8 /100 | #70 | Exceptional 5.4% |
| Immigrants | Western Asia | 99.8 /100 | #71 | Exceptional 5.4% |
| Lithuanians | 99.8 /100 | #72 | Exceptional 5.4% |
| Immigrants | Romania | 99.8 /100 | #73 | Exceptional 5.4% |
| Ethiopians | 99.7 /100 | #74 | Exceptional 5.4% |
| Immigrants | Indonesia | 99.7 /100 | #75 | Exceptional 5.3% |
| Immigrants | Canada | 99.7 /100 | #76 | Exceptional 5.3% |
| Immigrants | Ethiopia | 99.7 /100 | #77 | Exceptional 5.3% |
| Armenians | 99.7 /100 | #78 | Exceptional 5.3% |
| Immigrants | North America | 99.7 /100 | #79 | Exceptional 5.3% |
Demographics Similar to Immigrants from Costa Rica by Professional Degree
In terms of professional degree, the demographic groups most similar to Immigrants from Costa Rica are Immigrants from Kenya (4.4%, a difference of 0.11%), Celtic (4.4%, a difference of 0.13%), Czech (4.4%, a difference of 0.26%), Immigrants from Peru (4.4%, a difference of 0.39%), and Danish (4.4%, a difference of 0.47%).
| Demographics | Rating | Rank | Professional Degree |
| Immigrants | Bangladesh | 56.0 /100 | #171 | Average 4.4% |
| Spaniards | 52.0 /100 | #172 | Average 4.4% |
| English | 50.1 /100 | #173 | Average 4.4% |
| Kenyans | 50.0 /100 | #174 | Average 4.4% |
| Irish | 50.0 /100 | #175 | Average 4.4% |
| Immigrants | Peru | 49.3 /100 | #176 | Average 4.4% |
| Celtics | 47.6 /100 | #177 | Average 4.4% |
| Immigrants | Costa Rica | 46.7 /100 | #178 | Average 4.4% |
| Immigrants | Kenya | 45.9 /100 | #179 | Average 4.4% |
| Czechs | 44.9 /100 | #180 | Average 4.4% |
| Danes | 43.5 /100 | #181 | Average 4.4% |
| Immigrants | Immigrants | 43.2 /100 | #182 | Average 4.4% |
| Bermudans | 43.1 /100 | #183 | Average 4.4% |
| Belgians | 36.2 /100 | #184 | Fair 4.3% |
| Welsh | 35.8 /100 | #185 | Fair 4.3% |