Swiss vs British West Indian 11th Grade
COMPARE
Swiss
British West Indian
11th Grade
11th Grade Comparison
Swiss
British West Indians
93.6%
11TH GRADE
99.0/ 100
METRIC RATING
94th/ 347
METRIC RANK
90.3%
11TH GRADE
0.0/ 100
METRIC RATING
289th/ 347
METRIC RANK
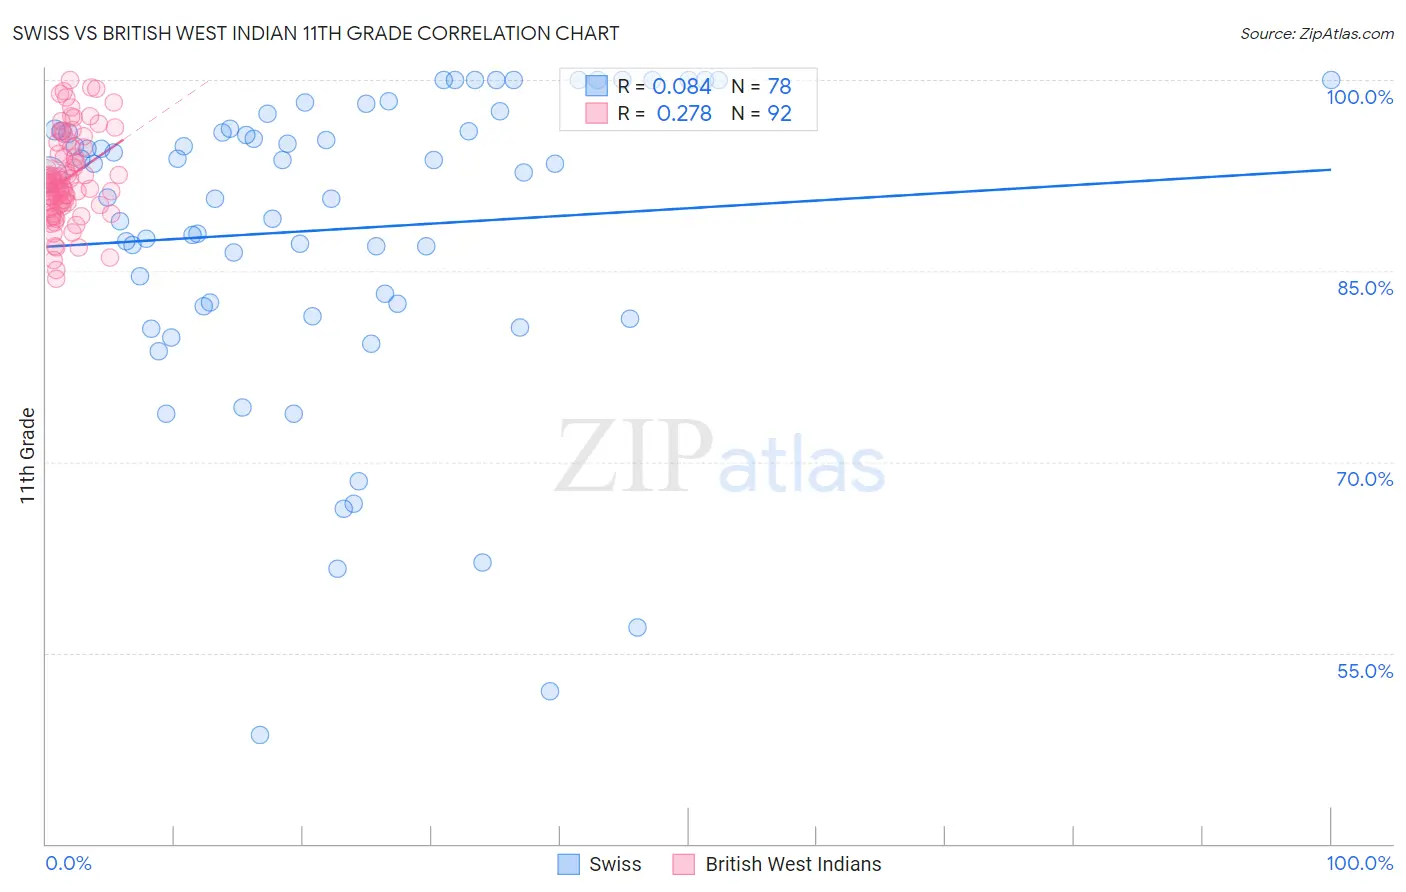
Swiss vs British West Indian 11th Grade Correlation Chart
The statistical analysis conducted on geographies consisting of 465,022,572 people shows a slight positive correlation between the proportion of Swiss and percentage of population with at least 11th grade education in the United States with a correlation coefficient (R) of 0.084 and weighted average of 93.6%. Similarly, the statistical analysis conducted on geographies consisting of 152,691,173 people shows a weak positive correlation between the proportion of British West Indians and percentage of population with at least 11th grade education in the United States with a correlation coefficient (R) of 0.278 and weighted average of 90.3%, a difference of 3.6%.
11th Grade Correlation Summary
| Measurement | Swiss | British West Indian |
| Minimum | 48.5% | 84.4% |
| Maximum | 100.0% | 100.0% |
| Range | 51.5% | 15.6% |
| Mean | 88.2% | 92.3% |
| Median | 93.0% | 91.9% |
| Interquartile 25% (IQ1) | 82.4% | 90.2% |
| Interquartile 75% (IQ3) | 96.1% | 94.4% |
| Interquartile Range (IQR) | 13.7% | 4.2% |
| Standard Deviation (Sample) | 12.0% | 3.4% |
| Standard Deviation (Population) | 11.9% | 3.4% |
Similar Demographics by 11th Grade
Demographics Similar to Swiss by 11th Grade
In terms of 11th grade, the demographic groups most similar to Swiss are Immigrants from France (93.6%, a difference of 0.0%), Puget Sound Salish (93.6%, a difference of 0.020%), Immigrants from Turkey (93.5%, a difference of 0.020%), Immigrants from Iran (93.5%, a difference of 0.030%), and South African (93.6%, a difference of 0.040%).
| Demographics | Rating | Rank | 11th Grade |
| Immigrants | Western Europe | 99.2 /100 | #87 | Exceptional 93.6% |
| Cambodians | 99.2 /100 | #88 | Exceptional 93.6% |
| Burmese | 99.2 /100 | #89 | Exceptional 93.6% |
| Ottawa | 99.2 /100 | #90 | Exceptional 93.6% |
| South Africans | 99.2 /100 | #91 | Exceptional 93.6% |
| Immigrants | Bulgaria | 99.1 /100 | #92 | Exceptional 93.6% |
| Puget Sound Salish | 99.1 /100 | #93 | Exceptional 93.6% |
| Swiss | 99.0 /100 | #94 | Exceptional 93.6% |
| Immigrants | France | 99.0 /100 | #95 | Exceptional 93.6% |
| Immigrants | Turkey | 98.9 /100 | #96 | Exceptional 93.5% |
| Immigrants | Iran | 98.9 /100 | #97 | Exceptional 93.5% |
| Immigrants | Israel | 98.8 /100 | #98 | Exceptional 93.5% |
| Menominee | 98.7 /100 | #99 | Exceptional 93.5% |
| Immigrants | North Macedonia | 98.7 /100 | #100 | Exceptional 93.5% |
| Immigrants | Romania | 98.7 /100 | #101 | Exceptional 93.5% |
Demographics Similar to British West Indians by 11th Grade
In terms of 11th grade, the demographic groups most similar to British West Indians are Pennsylvania German (90.3%, a difference of 0.020%), Indonesian (90.3%, a difference of 0.020%), Immigrants from West Indies (90.4%, a difference of 0.050%), Apache (90.4%, a difference of 0.050%), and Haitian (90.3%, a difference of 0.060%).
| Demographics | Rating | Rank | 11th Grade |
| Immigrants | St. Vincent and the Grenadines | 0.0 /100 | #282 | Tragic 90.7% |
| Immigrants | Barbados | 0.0 /100 | #283 | Tragic 90.7% |
| Immigrants | Laos | 0.0 /100 | #284 | Tragic 90.5% |
| Immigrants | Burma/Myanmar | 0.0 /100 | #285 | Tragic 90.4% |
| Immigrants | West Indies | 0.0 /100 | #286 | Tragic 90.4% |
| Apache | 0.0 /100 | #287 | Tragic 90.4% |
| Pennsylvania Germans | 0.0 /100 | #288 | Tragic 90.3% |
| British West Indians | 0.0 /100 | #289 | Tragic 90.3% |
| Indonesians | 0.0 /100 | #290 | Tragic 90.3% |
| Haitians | 0.0 /100 | #291 | Tragic 90.3% |
| Cubans | 0.0 /100 | #292 | Tragic 90.2% |
| Natives/Alaskans | 0.0 /100 | #293 | Tragic 90.2% |
| Immigrants | Grenada | 0.0 /100 | #294 | Tragic 90.1% |
| Immigrants | Vietnam | 0.0 /100 | #295 | Tragic 90.0% |
| Fijians | 0.0 /100 | #296 | Tragic 90.0% |