Celtic vs American Master's Degree
COMPARE
Celtic
American
Master's Degree
Master's Degree Comparison
Celtics
Americans
14.8%
MASTER'S DEGREE
41.3/ 100
METRIC RATING
180th/ 347
METRIC RANK
12.3%
MASTER'S DEGREE
0.4/ 100
METRIC RATING
267th/ 347
METRIC RANK
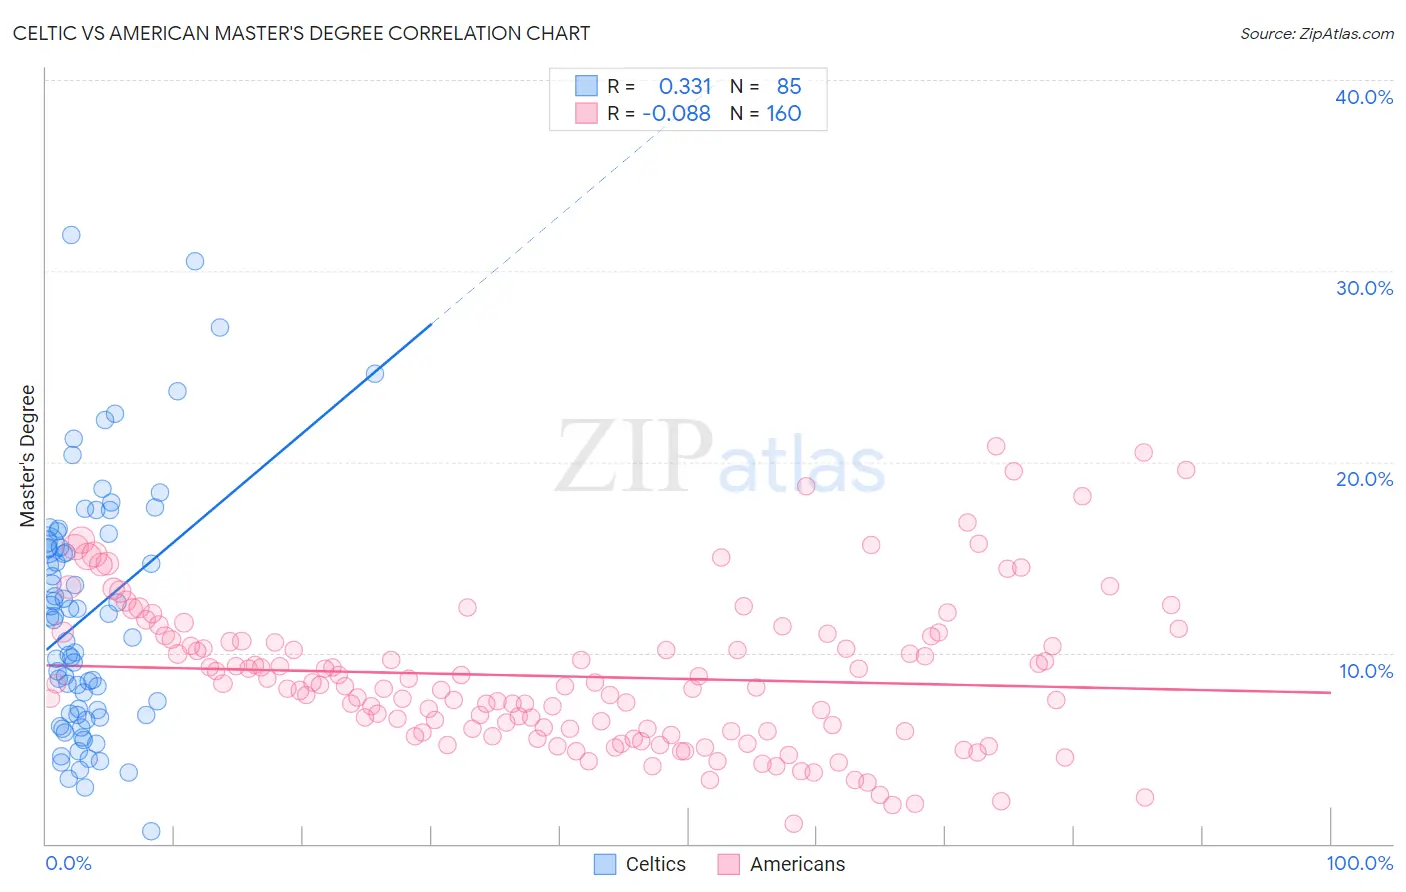
Celtic vs American Master's Degree Correlation Chart
The statistical analysis conducted on geographies consisting of 168,868,569 people shows a mild positive correlation between the proportion of Celtics and percentage of population with at least master's degree education in the United States with a correlation coefficient (R) of 0.331 and weighted average of 14.8%. Similarly, the statistical analysis conducted on geographies consisting of 580,510,045 people shows a slight negative correlation between the proportion of Americans and percentage of population with at least master's degree education in the United States with a correlation coefficient (R) of -0.088 and weighted average of 12.3%, a difference of 19.9%.
Master's Degree Correlation Summary
| Measurement | Celtic | American |
| Minimum | 0.67% | 1.1% |
| Maximum | 31.9% | 20.8% |
| Range | 31.2% | 19.8% |
| Mean | 12.0% | 8.8% |
| Median | 11.9% | 8.3% |
| Interquartile 25% (IQ1) | 6.8% | 5.9% |
| Interquartile 75% (IQ3) | 15.7% | 10.8% |
| Interquartile Range (IQR) | 9.0% | 4.9% |
| Standard Deviation (Sample) | 6.4% | 3.9% |
| Standard Deviation (Population) | 6.3% | 3.9% |
Similar Demographics by Master's Degree
Demographics Similar to Celtics by Master's Degree
In terms of master's degree, the demographic groups most similar to Celtics are Immigrants from Iraq (14.8%, a difference of 0.010%), Swiss (14.7%, a difference of 0.020%), Czech (14.7%, a difference of 0.12%), Sri Lankan (14.7%, a difference of 0.22%), and Immigrants from Zaire (14.7%, a difference of 0.25%).
| Demographics | Rating | Rank | Master's Degree |
| Costa Ricans | 52.5 /100 | #173 | Average 15.0% |
| Slovaks | 50.0 /100 | #174 | Average 14.9% |
| Immigrants | Peru | 49.6 /100 | #175 | Average 14.9% |
| Nigerians | 48.6 /100 | #176 | Average 14.9% |
| Immigrants | Colombia | 48.3 /100 | #177 | Average 14.9% |
| English | 45.0 /100 | #178 | Average 14.8% |
| Immigrants | Iraq | 41.3 /100 | #179 | Average 14.8% |
| Celtics | 41.3 /100 | #180 | Average 14.8% |
| Swiss | 41.1 /100 | #181 | Average 14.7% |
| Czechs | 40.4 /100 | #182 | Average 14.7% |
| Sri Lankans | 39.6 /100 | #183 | Fair 14.7% |
| Immigrants | Zaire | 39.5 /100 | #184 | Fair 14.7% |
| Barbadians | 38.3 /100 | #185 | Fair 14.7% |
| Immigrants | Oceania | 37.1 /100 | #186 | Fair 14.7% |
| Basques | 36.5 /100 | #187 | Fair 14.7% |
Demographics Similar to Americans by Master's Degree
In terms of master's degree, the demographic groups most similar to Americans are Native Hawaiian (12.3%, a difference of 0.25%), Bahamian (12.4%, a difference of 0.76%), Central American (12.2%, a difference of 0.90%), Immigrants from Fiji (12.4%, a difference of 0.91%), and Belizean (12.4%, a difference of 0.93%).
| Demographics | Rating | Rank | Master's Degree |
| Dominicans | 0.6 /100 | #260 | Tragic 12.5% |
| Tongans | 0.6 /100 | #261 | Tragic 12.5% |
| Nicaraguans | 0.6 /100 | #262 | Tragic 12.5% |
| Central American Indians | 0.5 /100 | #263 | Tragic 12.4% |
| Belizeans | 0.5 /100 | #264 | Tragic 12.4% |
| Immigrants | Fiji | 0.5 /100 | #265 | Tragic 12.4% |
| Bahamians | 0.5 /100 | #266 | Tragic 12.4% |
| Americans | 0.4 /100 | #267 | Tragic 12.3% |
| Native Hawaiians | 0.4 /100 | #268 | Tragic 12.3% |
| Central Americans | 0.3 /100 | #269 | Tragic 12.2% |
| Salvadorans | 0.3 /100 | #270 | Tragic 12.2% |
| Haitians | 0.3 /100 | #271 | Tragic 12.1% |
| Comanche | 0.3 /100 | #272 | Tragic 12.1% |
| Blackfeet | 0.3 /100 | #273 | Tragic 12.1% |
| Cape Verdeans | 0.3 /100 | #274 | Tragic 12.1% |