Liberian vs South African Divorced or Separated
COMPARE
Liberian
South African
Divorced or Separated
Divorced or Separated Comparison
Liberians
South Africans
12.6%
DIVORCED OR SEPARATED
0.9/ 100
METRIC RATING
252nd/ 347
METRIC RANK
11.8%
DIVORCED OR SEPARATED
88.9/ 100
METRIC RATING
127th/ 347
METRIC RANK
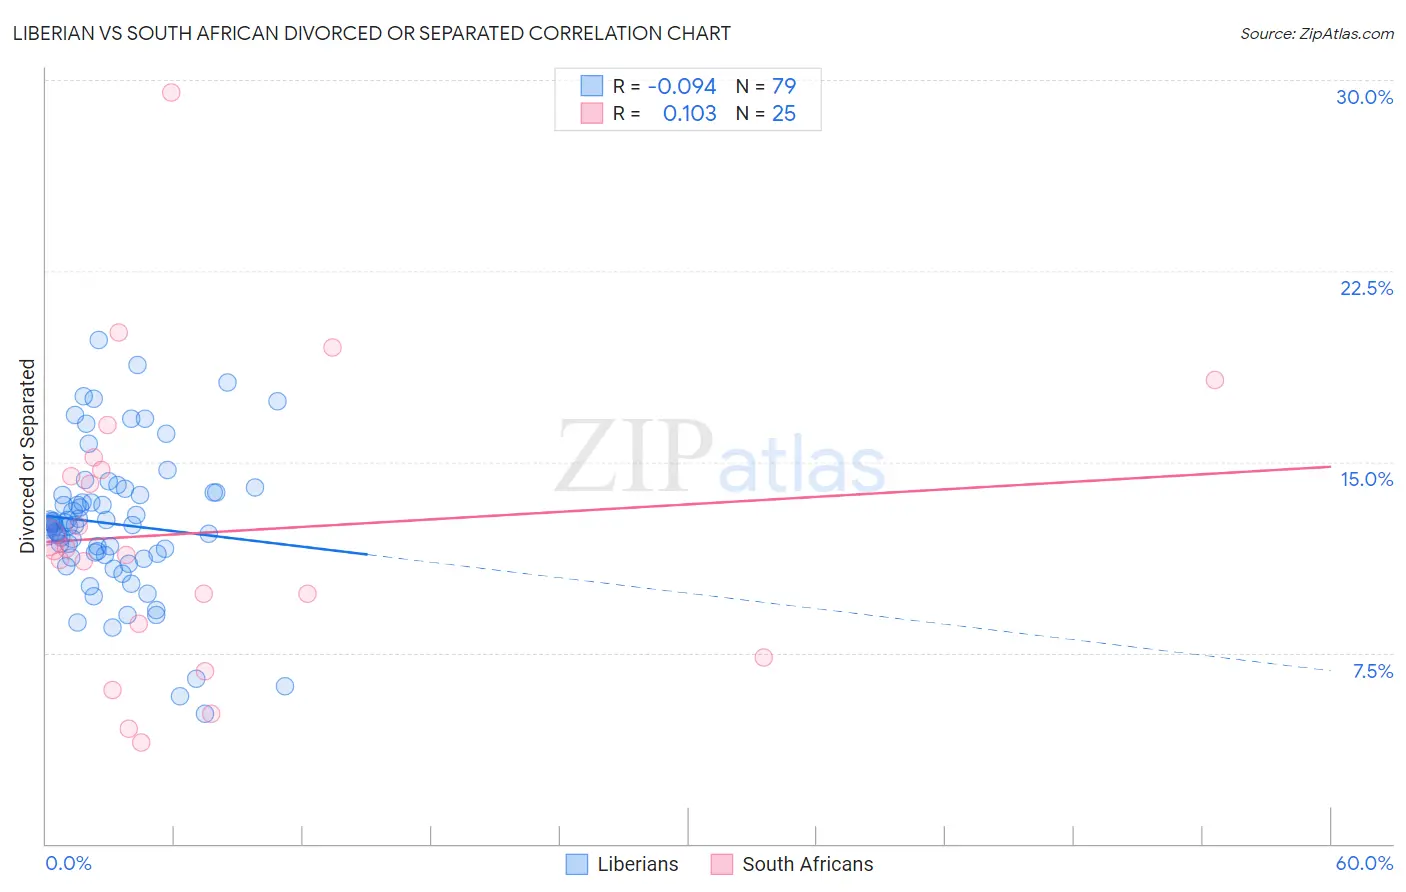
Liberian vs South African Divorced or Separated Correlation Chart
The statistical analysis conducted on geographies consisting of 118,063,038 people shows a slight negative correlation between the proportion of Liberians and percentage of population currently divorced or separated in the United States with a correlation coefficient (R) of -0.094 and weighted average of 12.6%. Similarly, the statistical analysis conducted on geographies consisting of 182,556,783 people shows a poor positive correlation between the proportion of South Africans and percentage of population currently divorced or separated in the United States with a correlation coefficient (R) of 0.103 and weighted average of 11.8%, a difference of 6.0%.
Divorced or Separated Correlation Summary
| Measurement | Liberian | South African |
| Minimum | 5.1% | 4.0% |
| Maximum | 19.8% | 29.5% |
| Range | 14.7% | 25.5% |
| Mean | 12.6% | 12.2% |
| Median | 12.5% | 11.5% |
| Interquartile 25% (IQ1) | 11.3% | 8.0% |
| Interquartile 75% (IQ3) | 13.8% | 14.9% |
| Interquartile Range (IQR) | 2.5% | 7.0% |
| Standard Deviation (Sample) | 2.8% | 5.7% |
| Standard Deviation (Population) | 2.8% | 5.6% |
Similar Demographics by Divorced or Separated
Demographics Similar to Liberians by Divorced or Separated
In terms of divorced or separated, the demographic groups most similar to Liberians are Somali (12.6%, a difference of 0.0%), Senegalese (12.6%, a difference of 0.060%), Welsh (12.6%, a difference of 0.16%), Immigrants from Colombia (12.6%, a difference of 0.32%), and Irish (12.5%, a difference of 0.33%).
| Demographics | Rating | Rank | Divorced or Separated |
| Hispanics or Latinos | 2.0 /100 | #245 | Tragic 12.5% |
| Immigrants | West Indies | 1.9 /100 | #246 | Tragic 12.5% |
| Germans | 1.8 /100 | #247 | Tragic 12.5% |
| Nepalese | 1.8 /100 | #248 | Tragic 12.5% |
| Finns | 1.8 /100 | #249 | Tragic 12.5% |
| Irish | 1.3 /100 | #250 | Tragic 12.5% |
| Aleuts | 1.3 /100 | #251 | Tragic 12.5% |
| Liberians | 0.9 /100 | #252 | Tragic 12.6% |
| Somalis | 0.9 /100 | #253 | Tragic 12.6% |
| Senegalese | 0.8 /100 | #254 | Tragic 12.6% |
| Welsh | 0.7 /100 | #255 | Tragic 12.6% |
| Immigrants | Colombia | 0.6 /100 | #256 | Tragic 12.6% |
| Immigrants | Somalia | 0.6 /100 | #257 | Tragic 12.6% |
| Indonesians | 0.6 /100 | #258 | Tragic 12.6% |
| Yuman | 0.6 /100 | #259 | Tragic 12.6% |
Demographics Similar to South Africans by Divorced or Separated
In terms of divorced or separated, the demographic groups most similar to South Africans are Immigrants from Ecuador (11.8%, a difference of 0.0%), Immigrants from St. Vincent and the Grenadines (11.8%, a difference of 0.040%), Immigrants from Austria (11.8%, a difference of 0.060%), Immigrants from Cambodia (11.8%, a difference of 0.060%), and Immigrants from Afghanistan (11.8%, a difference of 0.090%).
| Demographics | Rating | Rank | Divorced or Separated |
| Iraqis | 94.6 /100 | #120 | Exceptional 11.8% |
| Romanians | 94.5 /100 | #121 | Exceptional 11.8% |
| Menominee | 93.8 /100 | #122 | Exceptional 11.8% |
| Immigrants | Immigrants | 93.7 /100 | #123 | Exceptional 11.8% |
| Ugandans | 93.1 /100 | #124 | Exceptional 11.8% |
| Ukrainians | 92.3 /100 | #125 | Exceptional 11.8% |
| South American Indians | 92.1 /100 | #126 | Exceptional 11.8% |
| South Africans | 88.9 /100 | #127 | Excellent 11.8% |
| Immigrants | Ecuador | 88.9 /100 | #128 | Excellent 11.8% |
| Immigrants | St. Vincent and the Grenadines | 88.4 /100 | #129 | Excellent 11.8% |
| Immigrants | Austria | 88.2 /100 | #130 | Excellent 11.8% |
| Immigrants | Cambodia | 88.2 /100 | #131 | Excellent 11.8% |
| Immigrants | Afghanistan | 87.9 /100 | #132 | Excellent 11.8% |
| New Zealanders | 87.5 /100 | #133 | Excellent 11.9% |
| Argentineans | 85.1 /100 | #134 | Excellent 11.9% |