Trinidadian and Tobagonian vs South African Nursery School
COMPARE
Trinidadian and Tobagonian
South African
Nursery School
Nursery School Comparison
Trinidadians and Tobagonians
South Africans
97.4%
NURSERY SCHOOL
0.0/ 100
METRIC RATING
281st/ 347
METRIC RANK
98.3%
NURSERY SCHOOL
98.6/ 100
METRIC RATING
95th/ 347
METRIC RANK
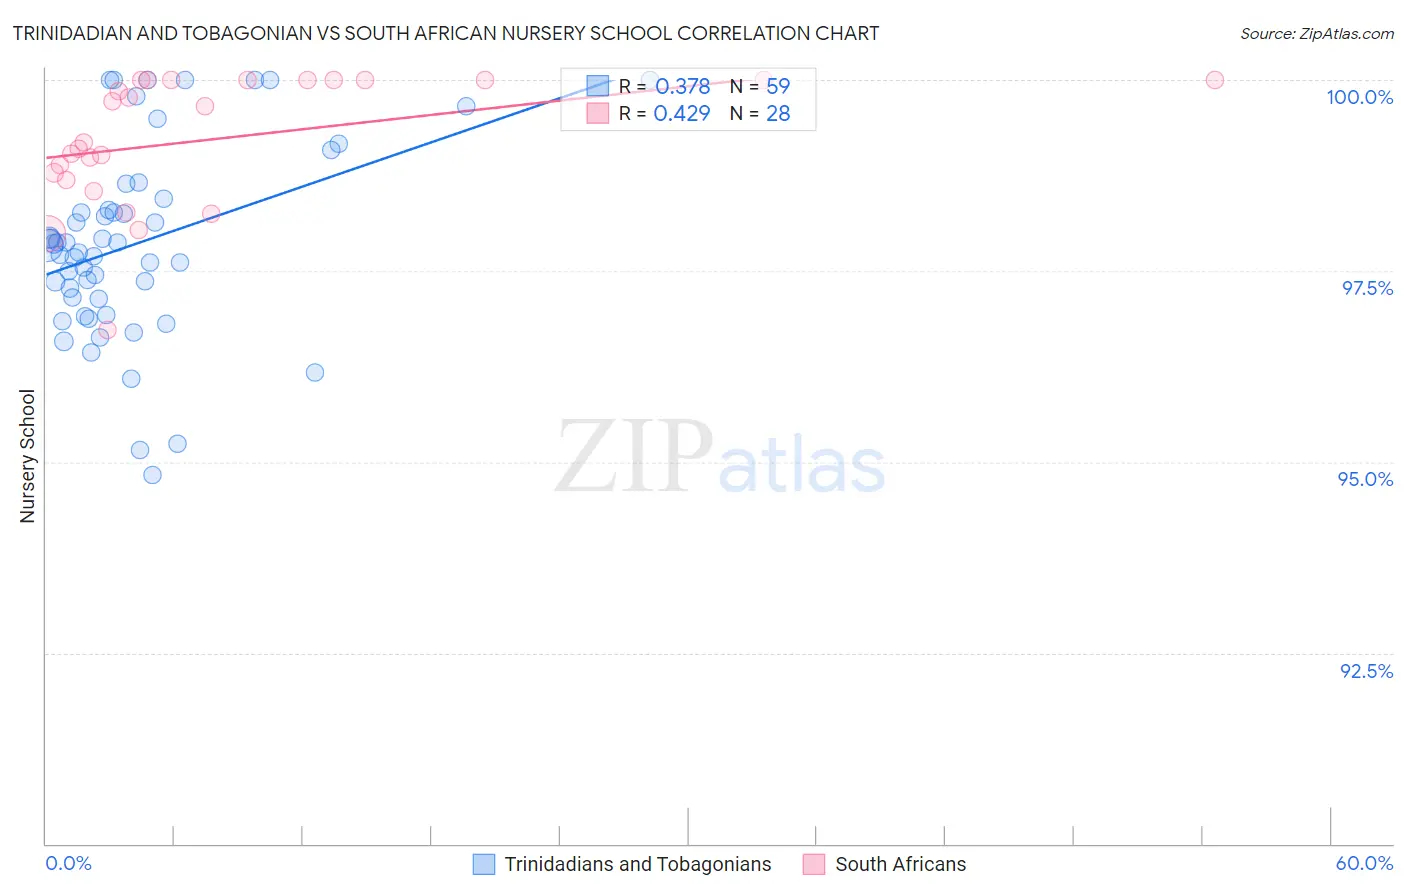
Trinidadian and Tobagonian vs South African Nursery School Correlation Chart
The statistical analysis conducted on geographies consisting of 219,882,819 people shows a mild positive correlation between the proportion of Trinidadians and Tobagonians and percentage of population with at least nursery school education in the United States with a correlation coefficient (R) of 0.378 and weighted average of 97.4%. Similarly, the statistical analysis conducted on geographies consisting of 182,602,894 people shows a moderate positive correlation between the proportion of South Africans and percentage of population with at least nursery school education in the United States with a correlation coefficient (R) of 0.429 and weighted average of 98.3%, a difference of 0.89%.
Nursery School Correlation Summary
| Measurement | Trinidadian and Tobagonian | South African |
| Minimum | 94.8% | 96.7% |
| Maximum | 100.0% | 100.0% |
| Range | 5.2% | 3.3% |
| Mean | 97.9% | 99.2% |
| Median | 97.8% | 99.4% |
| Interquartile 25% (IQ1) | 97.1% | 98.7% |
| Interquartile 75% (IQ3) | 98.4% | 100.0% |
| Interquartile Range (IQR) | 1.3% | 1.3% |
| Standard Deviation (Sample) | 1.3% | 0.85% |
| Standard Deviation (Population) | 1.2% | 0.83% |
Similar Demographics by Nursery School
Demographics Similar to Trinidadians and Tobagonians by Nursery School
In terms of nursery school, the demographic groups most similar to Trinidadians and Tobagonians are Immigrants from Ghana (97.4%, a difference of 0.0%), Barbadian (97.4%, a difference of 0.0%), Afghan (97.4%, a difference of 0.0%), Immigrants from Uzbekistan (97.4%, a difference of 0.010%), and Immigrants from Western Africa (97.4%, a difference of 0.020%).
| Demographics | Rating | Rank | Nursery School |
| Immigrants | Cameroon | 0.1 /100 | #274 | Tragic 97.5% |
| Ghanaians | 0.1 /100 | #275 | Tragic 97.5% |
| Immigrants | Philippines | 0.1 /100 | #276 | Tragic 97.5% |
| Immigrants | Western Africa | 0.1 /100 | #277 | Tragic 97.4% |
| Immigrants | Uzbekistan | 0.1 /100 | #278 | Tragic 97.4% |
| Immigrants | Ghana | 0.1 /100 | #279 | Tragic 97.4% |
| Barbadians | 0.0 /100 | #280 | Tragic 97.4% |
| Trinidadians and Tobagonians | 0.0 /100 | #281 | Tragic 97.4% |
| Afghans | 0.0 /100 | #282 | Tragic 97.4% |
| Immigrants | West Indies | 0.0 /100 | #283 | Tragic 97.4% |
| Immigrants | Trinidad and Tobago | 0.0 /100 | #284 | Tragic 97.4% |
| Immigrants | Barbados | 0.0 /100 | #285 | Tragic 97.4% |
| Immigrants | Portugal | 0.0 /100 | #286 | Tragic 97.4% |
| Immigrants | Hong Kong | 0.0 /100 | #287 | Tragic 97.4% |
| Immigrants | Thailand | 0.0 /100 | #288 | Tragic 97.3% |
Demographics Similar to South Africans by Nursery School
In terms of nursery school, the demographic groups most similar to South Africans are Immigrants from Germany (98.3%, a difference of 0.0%), Zimbabwean (98.3%, a difference of 0.010%), Macedonian (98.3%, a difference of 0.010%), Immigrants from India (98.3%, a difference of 0.010%), and Cypriot (98.3%, a difference of 0.010%).
| Demographics | Rating | Rank | Nursery School |
| Ukrainians | 98.9 /100 | #88 | Exceptional 98.3% |
| Immigrants | South Africa | 98.8 /100 | #89 | Exceptional 98.3% |
| Immigrants | Western Europe | 98.8 /100 | #90 | Exceptional 98.3% |
| Zimbabweans | 98.8 /100 | #91 | Exceptional 98.3% |
| Macedonians | 98.7 /100 | #92 | Exceptional 98.3% |
| Immigrants | India | 98.7 /100 | #93 | Exceptional 98.3% |
| Immigrants | Germany | 98.6 /100 | #94 | Exceptional 98.3% |
| South Africans | 98.6 /100 | #95 | Exceptional 98.3% |
| Cypriots | 98.3 /100 | #96 | Exceptional 98.3% |
| Immigrants | Nonimmigrants | 98.3 /100 | #97 | Exceptional 98.3% |
| Choctaw | 98.3 /100 | #98 | Exceptional 98.3% |
| Colville | 98.2 /100 | #99 | Exceptional 98.3% |
| Puget Sound Salish | 98.0 /100 | #100 | Exceptional 98.3% |
| Romanians | 97.9 /100 | #101 | Exceptional 98.3% |
| Immigrants | Ireland | 97.7 /100 | #102 | Exceptional 98.3% |