Liberian vs Immigrants from Liberia 11th Grade
COMPARE
Liberian
Immigrants from Liberia
11th Grade
11th Grade Comparison
Liberians
Immigrants from Liberia
92.3%
11TH GRADE
26.8/ 100
METRIC RATING
195th/ 347
METRIC RANK
91.9%
11TH GRADE
7.0/ 100
METRIC RATING
221st/ 347
METRIC RANK
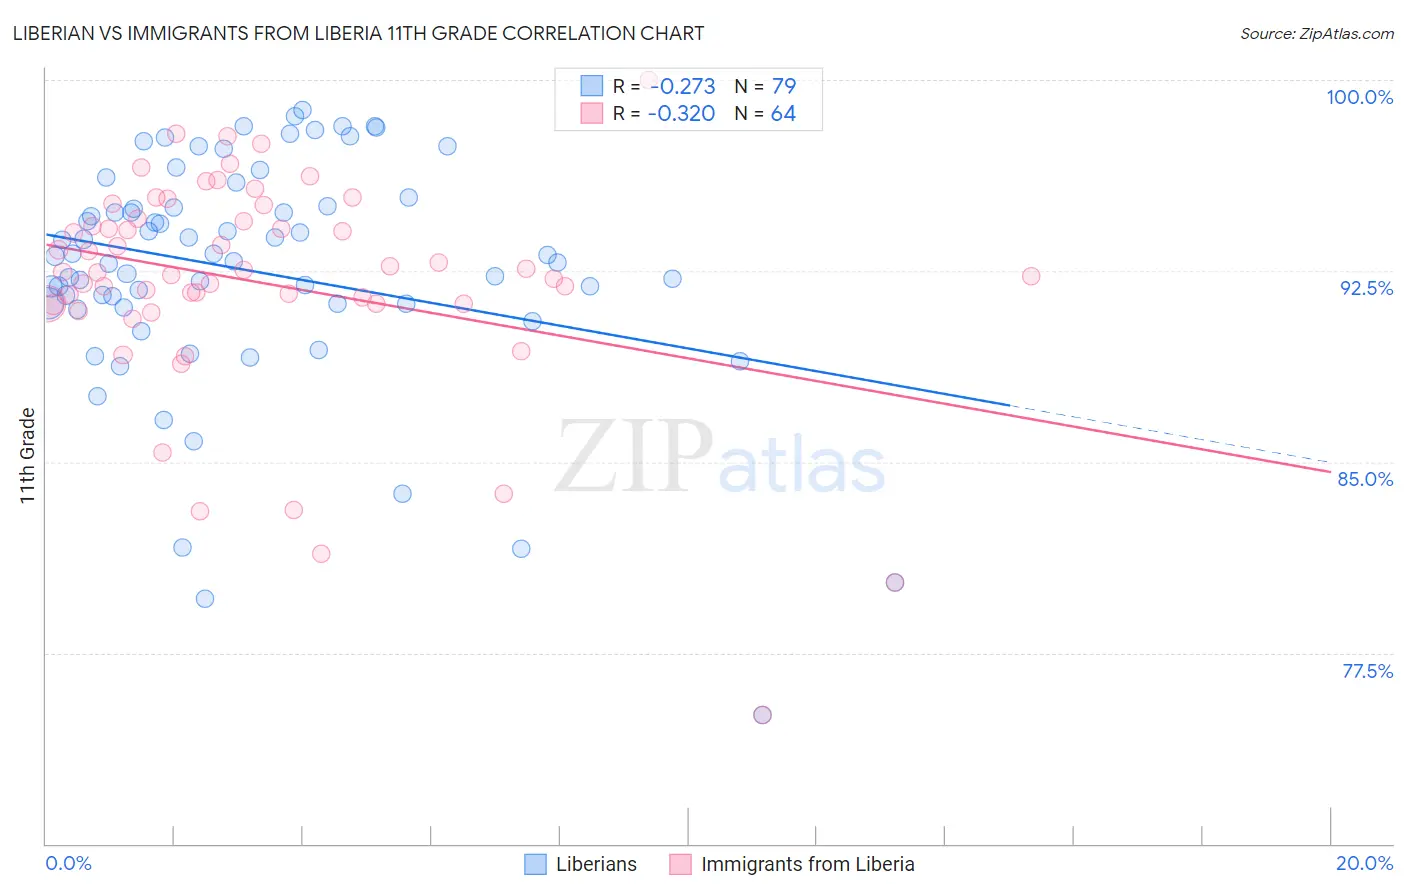
Liberian vs Immigrants from Liberia 11th Grade Correlation Chart
The statistical analysis conducted on geographies consisting of 118,101,728 people shows a weak negative correlation between the proportion of Liberians and percentage of population with at least 11th grade education in the United States with a correlation coefficient (R) of -0.273 and weighted average of 92.3%. Similarly, the statistical analysis conducted on geographies consisting of 135,293,967 people shows a mild negative correlation between the proportion of Immigrants from Liberia and percentage of population with at least 11th grade education in the United States with a correlation coefficient (R) of -0.320 and weighted average of 91.9%, a difference of 0.39%.
11th Grade Correlation Summary
| Measurement | Liberian | Immigrants from Liberia |
| Minimum | 75.1% | 75.1% |
| Maximum | 98.8% | 100.0% |
| Range | 23.7% | 24.9% |
| Mean | 92.5% | 92.0% |
| Median | 93.1% | 92.4% |
| Interquartile 25% (IQ1) | 91.2% | 91.2% |
| Interquartile 75% (IQ3) | 95.1% | 94.5% |
| Interquartile Range (IQR) | 3.8% | 3.3% |
| Standard Deviation (Sample) | 4.6% | 4.4% |
| Standard Deviation (Population) | 4.6% | 4.4% |
Similar Demographics by 11th Grade
Demographics Similar to Liberians by 11th Grade
In terms of 11th grade, the demographic groups most similar to Liberians are Panamanian (92.3%, a difference of 0.010%), Marshallese (92.3%, a difference of 0.010%), Moroccan (92.3%, a difference of 0.020%), Sioux (92.3%, a difference of 0.020%), and Hawaiian (92.3%, a difference of 0.020%).
| Demographics | Rating | Rank | 11th Grade |
| Immigrants | Indonesia | 33.7 /100 | #188 | Fair 92.4% |
| Immigrants | Chile | 33.3 /100 | #189 | Fair 92.4% |
| Chickasaw | 31.4 /100 | #190 | Fair 92.3% |
| French American Indians | 30.8 /100 | #191 | Fair 92.3% |
| Immigrants | Syria | 30.4 /100 | #192 | Fair 92.3% |
| Moroccans | 28.7 /100 | #193 | Fair 92.3% |
| Sioux | 28.5 /100 | #194 | Fair 92.3% |
| Liberians | 26.8 /100 | #195 | Fair 92.3% |
| Panamanians | 26.4 /100 | #196 | Fair 92.3% |
| Marshallese | 26.0 /100 | #197 | Fair 92.3% |
| Hawaiians | 25.5 /100 | #198 | Fair 92.3% |
| Immigrants | Uganda | 25.2 /100 | #199 | Fair 92.3% |
| Samoans | 25.1 /100 | #200 | Fair 92.3% |
| Immigrants | China | 25.1 /100 | #201 | Fair 92.3% |
| Immigrants | Eastern Africa | 24.1 /100 | #202 | Fair 92.3% |
Demographics Similar to Immigrants from Liberia by 11th Grade
In terms of 11th grade, the demographic groups most similar to Immigrants from Liberia are South American Indian (92.0%, a difference of 0.020%), Immigrants from Africa (91.9%, a difference of 0.020%), Immigrants from Bahamas (91.9%, a difference of 0.020%), Costa Rican (91.9%, a difference of 0.030%), and Immigrants from Zaire (91.9%, a difference of 0.070%).
| Demographics | Rating | Rank | 11th Grade |
| Afghans | 12.8 /100 | #214 | Poor 92.1% |
| Immigrants | Southern Europe | 12.5 /100 | #215 | Poor 92.1% |
| Somalis | 11.6 /100 | #216 | Poor 92.1% |
| Immigrants | Sierra Leone | 11.1 /100 | #217 | Poor 92.0% |
| Blackfeet | 10.1 /100 | #218 | Poor 92.0% |
| Portuguese | 10.0 /100 | #219 | Tragic 92.0% |
| South American Indians | 7.6 /100 | #220 | Tragic 92.0% |
| Immigrants | Liberia | 7.0 /100 | #221 | Tragic 91.9% |
| Immigrants | Africa | 6.5 /100 | #222 | Tragic 91.9% |
| Immigrants | Bahamas | 6.5 /100 | #223 | Tragic 91.9% |
| Costa Ricans | 6.3 /100 | #224 | Tragic 91.9% |
| Immigrants | Zaire | 5.4 /100 | #225 | Tragic 91.9% |
| Immigrants | Somalia | 5.2 /100 | #226 | Tragic 91.9% |
| Immigrants | Cameroon | 4.4 /100 | #227 | Tragic 91.8% |
| Immigrants | Panama | 4.3 /100 | #228 | Tragic 91.8% |