Liberian vs Latvian High School Diploma
COMPARE
Liberian
Latvian
High School Diploma
High School Diploma Comparison
Liberians
Latvians
88.7%
HIGH SCHOOL DIPLOMA
18.8/ 100
METRIC RATING
198th/ 347
METRIC RANK
92.0%
HIGH SCHOOL DIPLOMA
100.0/ 100
METRIC RATING
9th/ 347
METRIC RANK
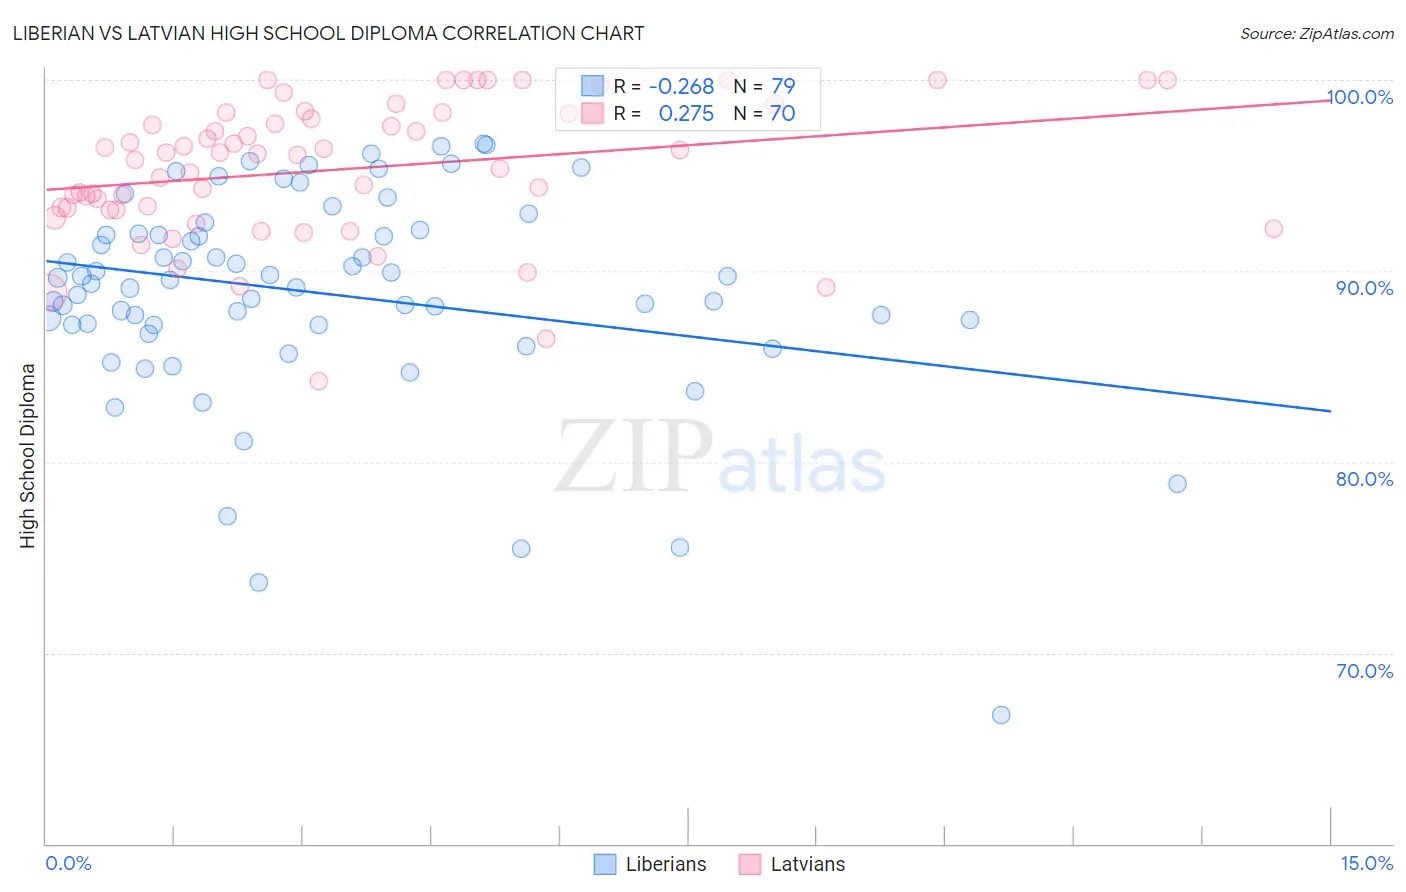
Liberian vs Latvian High School Diploma Correlation Chart
The statistical analysis conducted on geographies consisting of 118,101,728 people shows a weak negative correlation between the proportion of Liberians and percentage of population with at least high school diploma education in the United States with a correlation coefficient (R) of -0.268 and weighted average of 88.7%. Similarly, the statistical analysis conducted on geographies consisting of 220,726,693 people shows a weak positive correlation between the proportion of Latvians and percentage of population with at least high school diploma education in the United States with a correlation coefficient (R) of 0.275 and weighted average of 92.0%, a difference of 3.8%.
High School Diploma Correlation Summary
| Measurement | Liberian | Latvian |
| Minimum | 66.8% | 84.2% |
| Maximum | 96.6% | 100.0% |
| Range | 29.9% | 15.8% |
| Mean | 88.8% | 95.3% |
| Median | 89.5% | 96.1% |
| Interquartile 25% (IQ1) | 87.2% | 93.2% |
| Interquartile 75% (IQ3) | 91.9% | 98.2% |
| Interquartile Range (IQR) | 4.8% | 5.1% |
| Standard Deviation (Sample) | 5.5% | 3.6% |
| Standard Deviation (Population) | 5.5% | 3.5% |
Similar Demographics by High School Diploma
Demographics Similar to Liberians by High School Diploma
In terms of high school diploma, the demographic groups most similar to Liberians are Marshallese (88.6%, a difference of 0.0%), Hawaiian (88.6%, a difference of 0.010%), Korean (88.6%, a difference of 0.020%), Panamanian (88.6%, a difference of 0.020%), and Somali (88.6%, a difference of 0.030%).
| Demographics | Rating | Rank | High School Diploma |
| Immigrants | Ethiopia | 30.9 /100 | #191 | Fair 88.9% |
| Moroccans | 29.5 /100 | #192 | Fair 88.8% |
| Immigrants | Oceania | 26.9 /100 | #193 | Fair 88.8% |
| Immigrants | Venezuela | 25.8 /100 | #194 | Fair 88.8% |
| Afghans | 23.9 /100 | #195 | Fair 88.8% |
| Immigrants | Southern Europe | 23.4 /100 | #196 | Fair 88.7% |
| French American Indians | 21.5 /100 | #197 | Fair 88.7% |
| Liberians | 18.8 /100 | #198 | Poor 88.7% |
| Marshallese | 18.7 /100 | #199 | Poor 88.6% |
| Hawaiians | 18.3 /100 | #200 | Poor 88.6% |
| Koreans | 18.1 /100 | #201 | Poor 88.6% |
| Panamanians | 18.0 /100 | #202 | Poor 88.6% |
| Somalis | 17.5 /100 | #203 | Poor 88.6% |
| Armenians | 17.2 /100 | #204 | Poor 88.6% |
| Immigrants | Micronesia | 16.4 /100 | #205 | Poor 88.6% |
Demographics Similar to Latvians by High School Diploma
In terms of high school diploma, the demographic groups most similar to Latvians are Chinese (92.0%, a difference of 0.010%), Slovak (92.0%, a difference of 0.030%), Immigrants from India (92.0%, a difference of 0.030%), Croatian (92.0%, a difference of 0.030%), and Lithuanian (92.0%, a difference of 0.050%).
| Demographics | Rating | Rank | High School Diploma |
| Swedes | 100.0 /100 | #2 | Exceptional 92.2% |
| Carpatho Rusyns | 100.0 /100 | #3 | Exceptional 92.1% |
| Lithuanians | 100.0 /100 | #4 | Exceptional 92.0% |
| Slovenes | 100.0 /100 | #5 | Exceptional 92.0% |
| Slovaks | 100.0 /100 | #6 | Exceptional 92.0% |
| Immigrants | India | 100.0 /100 | #7 | Exceptional 92.0% |
| Chinese | 100.0 /100 | #8 | Exceptional 92.0% |
| Latvians | 100.0 /100 | #9 | Exceptional 92.0% |
| Croatians | 100.0 /100 | #10 | Exceptional 92.0% |
| Eastern Europeans | 100.0 /100 | #11 | Exceptional 91.9% |
| Poles | 100.0 /100 | #12 | Exceptional 91.9% |
| Danes | 100.0 /100 | #13 | Exceptional 91.8% |
| Bulgarians | 100.0 /100 | #14 | Exceptional 91.8% |
| Luxembourgers | 100.0 /100 | #15 | Exceptional 91.7% |
| Finns | 100.0 /100 | #16 | Exceptional 91.7% |