Immigrants from Israel vs Laotian 11th Grade
COMPARE
Immigrants from Israel
Laotian
11th Grade
11th Grade Comparison
Immigrants from Israel
Laotians
93.5%
11TH GRADE
98.8/ 100
METRIC RATING
98th/ 347
METRIC RANK
92.6%
11TH GRADE
54.4/ 100
METRIC RATING
171st/ 347
METRIC RANK
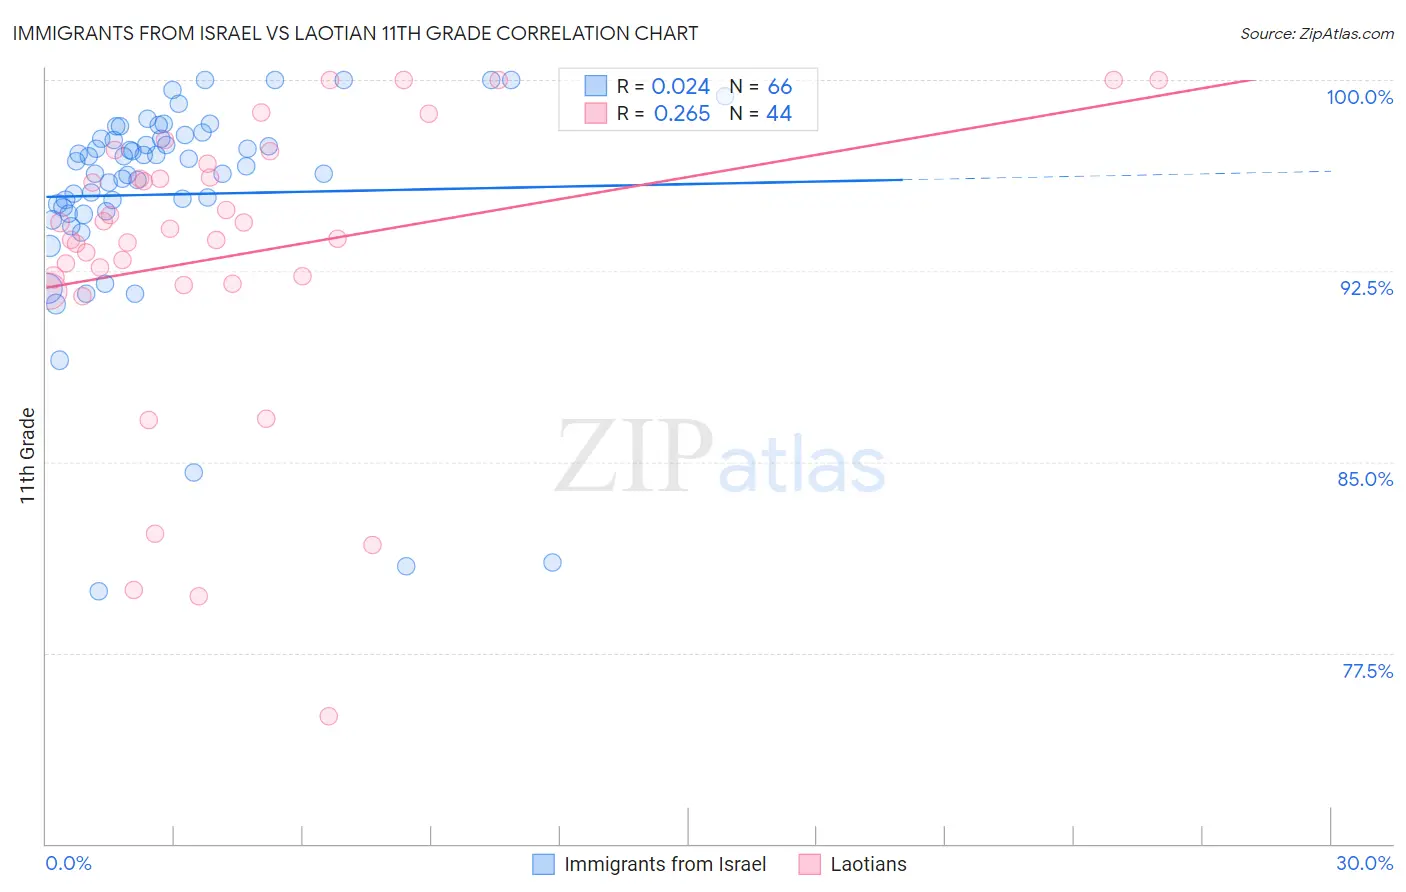
Immigrants from Israel vs Laotian 11th Grade Correlation Chart
The statistical analysis conducted on geographies consisting of 210,030,386 people shows no correlation between the proportion of Immigrants from Israel and percentage of population with at least 11th grade education in the United States with a correlation coefficient (R) of 0.024 and weighted average of 93.5%. Similarly, the statistical analysis conducted on geographies consisting of 224,854,130 people shows a weak positive correlation between the proportion of Laotians and percentage of population with at least 11th grade education in the United States with a correlation coefficient (R) of 0.265 and weighted average of 92.6%, a difference of 1.0%.
11th Grade Correlation Summary
| Measurement | Immigrants from Israel | Laotian |
| Minimum | 79.9% | 75.0% |
| Maximum | 100.0% | 100.0% |
| Range | 20.1% | 25.0% |
| Mean | 95.5% | 93.1% |
| Median | 96.7% | 93.9% |
| Interquartile 25% (IQ1) | 94.8% | 92.1% |
| Interquartile 75% (IQ3) | 97.7% | 96.4% |
| Interquartile Range (IQR) | 2.9% | 4.3% |
| Standard Deviation (Sample) | 4.3% | 5.8% |
| Standard Deviation (Population) | 4.2% | 5.7% |
Similar Demographics by 11th Grade
Demographics Similar to Immigrants from Israel by 11th Grade
In terms of 11th grade, the demographic groups most similar to Immigrants from Israel are Menominee (93.5%, a difference of 0.0%), Immigrants from North Macedonia (93.5%, a difference of 0.010%), Immigrants from Iran (93.5%, a difference of 0.020%), Immigrants from Romania (93.5%, a difference of 0.020%), and Immigrants from Turkey (93.5%, a difference of 0.030%).
| Demographics | Rating | Rank | 11th Grade |
| South Africans | 99.2 /100 | #91 | Exceptional 93.6% |
| Immigrants | Bulgaria | 99.1 /100 | #92 | Exceptional 93.6% |
| Puget Sound Salish | 99.1 /100 | #93 | Exceptional 93.6% |
| Swiss | 99.0 /100 | #94 | Exceptional 93.6% |
| Immigrants | France | 99.0 /100 | #95 | Exceptional 93.6% |
| Immigrants | Turkey | 98.9 /100 | #96 | Exceptional 93.5% |
| Immigrants | Iran | 98.9 /100 | #97 | Exceptional 93.5% |
| Immigrants | Israel | 98.8 /100 | #98 | Exceptional 93.5% |
| Menominee | 98.7 /100 | #99 | Exceptional 93.5% |
| Immigrants | North Macedonia | 98.7 /100 | #100 | Exceptional 93.5% |
| Immigrants | Romania | 98.7 /100 | #101 | Exceptional 93.5% |
| Chippewa | 98.6 /100 | #102 | Exceptional 93.5% |
| Lebanese | 98.6 /100 | #103 | Exceptional 93.5% |
| Immigrants | Europe | 98.6 /100 | #104 | Exceptional 93.5% |
| Immigrants | Serbia | 98.6 /100 | #105 | Exceptional 93.5% |
Demographics Similar to Laotians by 11th Grade
In terms of 11th grade, the demographic groups most similar to Laotians are Immigrants from Pakistan (92.5%, a difference of 0.020%), Immigrants from Albania (92.6%, a difference of 0.030%), Immigrants from Northern Africa (92.6%, a difference of 0.030%), Indian (Asian) (92.5%, a difference of 0.030%), and Sierra Leonean (92.6%, a difference of 0.040%).
| Demographics | Rating | Rank | 11th Grade |
| Spanish | 66.2 /100 | #164 | Good 92.7% |
| Immigrants | Iraq | 63.7 /100 | #165 | Good 92.6% |
| Bermudans | 62.3 /100 | #166 | Good 92.6% |
| Alsatians | 60.2 /100 | #167 | Good 92.6% |
| Sierra Leoneans | 58.7 /100 | #168 | Average 92.6% |
| Immigrants | Albania | 57.8 /100 | #169 | Average 92.6% |
| Immigrants | Northern Africa | 57.3 /100 | #170 | Average 92.6% |
| Laotians | 54.4 /100 | #171 | Average 92.6% |
| Immigrants | Pakistan | 52.3 /100 | #172 | Average 92.5% |
| Indians (Asian) | 51.5 /100 | #173 | Average 92.5% |
| Asians | 50.0 /100 | #174 | Average 92.5% |
| Shoshone | 48.9 /100 | #175 | Average 92.5% |
| Spaniards | 46.9 /100 | #176 | Average 92.5% |
| Guamanians/Chamorros | 45.0 /100 | #177 | Average 92.5% |
| Sudanese | 43.4 /100 | #178 | Average 92.5% |