Slovak vs Laotian 11th Grade
COMPARE
Slovak
Laotian
11th Grade
11th Grade Comparison
Slovaks
Laotians
94.9%
11TH GRADE
100.0/ 100
METRIC RATING
4th/ 347
METRIC RANK
92.6%
11TH GRADE
54.4/ 100
METRIC RATING
171st/ 347
METRIC RANK
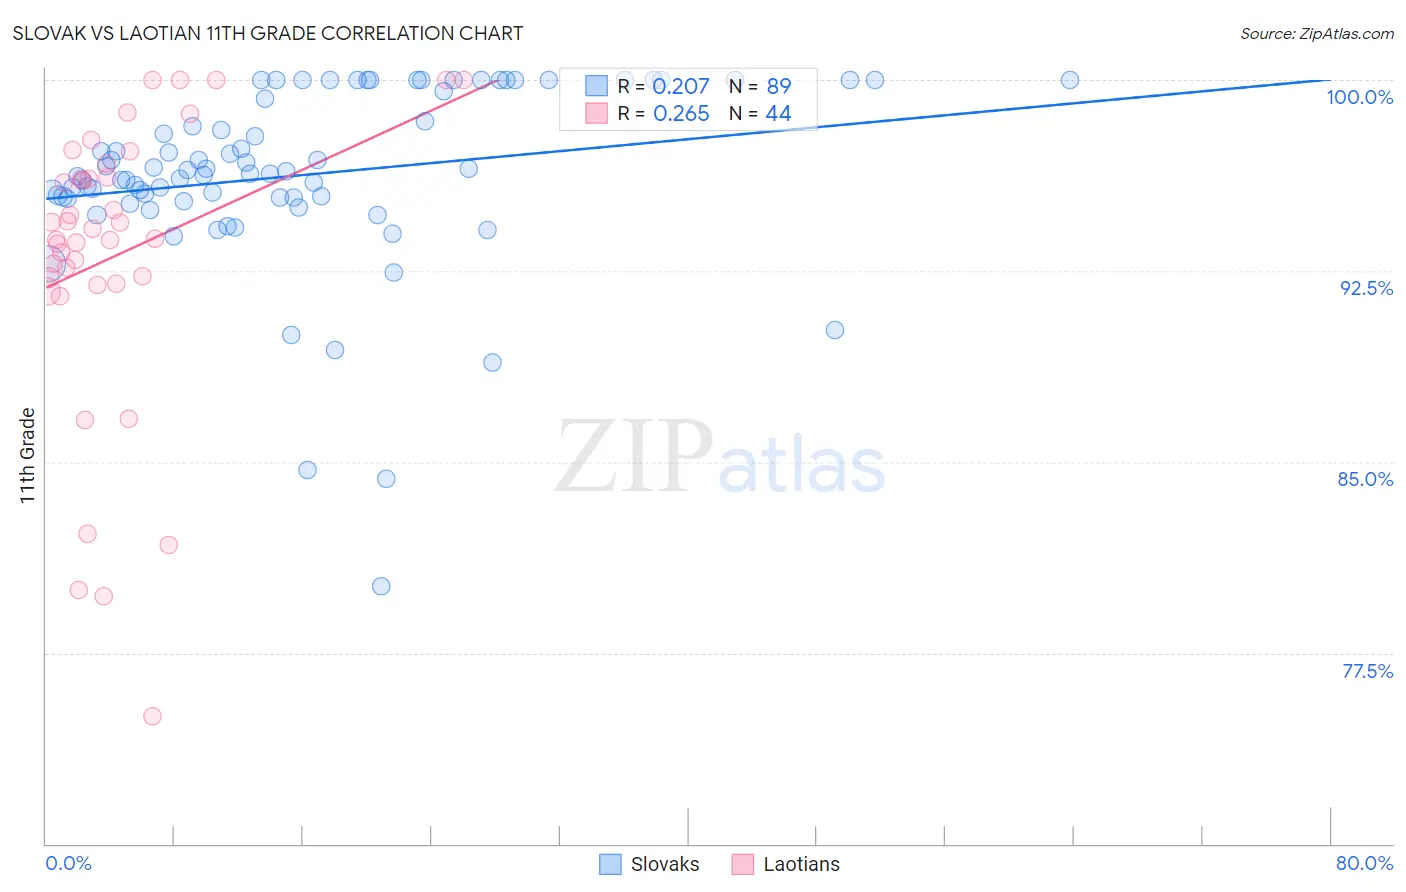
Slovak vs Laotian 11th Grade Correlation Chart
The statistical analysis conducted on geographies consisting of 397,891,887 people shows a weak positive correlation between the proportion of Slovaks and percentage of population with at least 11th grade education in the United States with a correlation coefficient (R) of 0.207 and weighted average of 94.9%. Similarly, the statistical analysis conducted on geographies consisting of 224,854,130 people shows a weak positive correlation between the proportion of Laotians and percentage of population with at least 11th grade education in the United States with a correlation coefficient (R) of 0.265 and weighted average of 92.6%, a difference of 2.5%.
11th Grade Correlation Summary
| Measurement | Slovak | Laotian |
| Minimum | 80.1% | 75.0% |
| Maximum | 100.0% | 100.0% |
| Range | 19.9% | 25.0% |
| Mean | 96.3% | 93.1% |
| Median | 96.3% | 93.9% |
| Interquartile 25% (IQ1) | 95.4% | 92.1% |
| Interquartile 75% (IQ3) | 99.8% | 96.4% |
| Interquartile Range (IQR) | 4.4% | 4.3% |
| Standard Deviation (Sample) | 3.6% | 5.8% |
| Standard Deviation (Population) | 3.6% | 5.7% |
Similar Demographics by 11th Grade
Demographics Similar to Slovaks by 11th Grade
In terms of 11th grade, the demographic groups most similar to Slovaks are Slovene (94.9%, a difference of 0.020%), Swedish (94.9%, a difference of 0.040%), Carpatho Rusyn (94.8%, a difference of 0.060%), Lithuanian (94.8%, a difference of 0.11%), and Polish (94.8%, a difference of 0.16%).
| Demographics | Rating | Rank | 11th Grade |
| Norwegians | 100.0 /100 | #1 | Exceptional 95.2% |
| Swedes | 100.0 /100 | #2 | Exceptional 94.9% |
| Slovenes | 100.0 /100 | #3 | Exceptional 94.9% |
| Slovaks | 100.0 /100 | #4 | Exceptional 94.9% |
| Carpatho Rusyns | 100.0 /100 | #5 | Exceptional 94.8% |
| Lithuanians | 100.0 /100 | #6 | Exceptional 94.8% |
| Poles | 100.0 /100 | #7 | Exceptional 94.8% |
| Croatians | 100.0 /100 | #8 | Exceptional 94.7% |
| Danes | 100.0 /100 | #9 | Exceptional 94.7% |
| Finns | 100.0 /100 | #10 | Exceptional 94.7% |
| Germans | 100.0 /100 | #11 | Exceptional 94.7% |
| Latvians | 100.0 /100 | #12 | Exceptional 94.7% |
| Chinese | 100.0 /100 | #13 | Exceptional 94.6% |
| Eastern Europeans | 100.0 /100 | #14 | Exceptional 94.6% |
| Bulgarians | 100.0 /100 | #15 | Exceptional 94.5% |
Demographics Similar to Laotians by 11th Grade
In terms of 11th grade, the demographic groups most similar to Laotians are Immigrants from Pakistan (92.5%, a difference of 0.020%), Immigrants from Albania (92.6%, a difference of 0.030%), Immigrants from Northern Africa (92.6%, a difference of 0.030%), Indian (Asian) (92.5%, a difference of 0.030%), and Sierra Leonean (92.6%, a difference of 0.040%).
| Demographics | Rating | Rank | 11th Grade |
| Spanish | 66.2 /100 | #164 | Good 92.7% |
| Immigrants | Iraq | 63.7 /100 | #165 | Good 92.6% |
| Bermudans | 62.3 /100 | #166 | Good 92.6% |
| Alsatians | 60.2 /100 | #167 | Good 92.6% |
| Sierra Leoneans | 58.7 /100 | #168 | Average 92.6% |
| Immigrants | Albania | 57.8 /100 | #169 | Average 92.6% |
| Immigrants | Northern Africa | 57.3 /100 | #170 | Average 92.6% |
| Laotians | 54.4 /100 | #171 | Average 92.6% |
| Immigrants | Pakistan | 52.3 /100 | #172 | Average 92.5% |
| Indians (Asian) | 51.5 /100 | #173 | Average 92.5% |
| Asians | 50.0 /100 | #174 | Average 92.5% |
| Shoshone | 48.9 /100 | #175 | Average 92.5% |
| Spaniards | 46.9 /100 | #176 | Average 92.5% |
| Guamanians/Chamorros | 45.0 /100 | #177 | Average 92.5% |
| Sudanese | 43.4 /100 | #178 | Average 92.5% |