Liberian vs Immigrants from Israel Unemployment Among Youth under 25 years
COMPARE
Liberian
Immigrants from Israel
Unemployment Among Youth under 25 years
Unemployment Among Youth under 25 years Comparison
Liberians
Immigrants from Israel
12.4%
UNEMPLOYMENT AMONG YOUTH UNDER 25 YEARS
0.2/ 100
METRIC RATING
256th/ 347
METRIC RANK
12.0%
UNEMPLOYMENT AMONG YOUTH UNDER 25 YEARS
2.6/ 100
METRIC RATING
226th/ 347
METRIC RANK
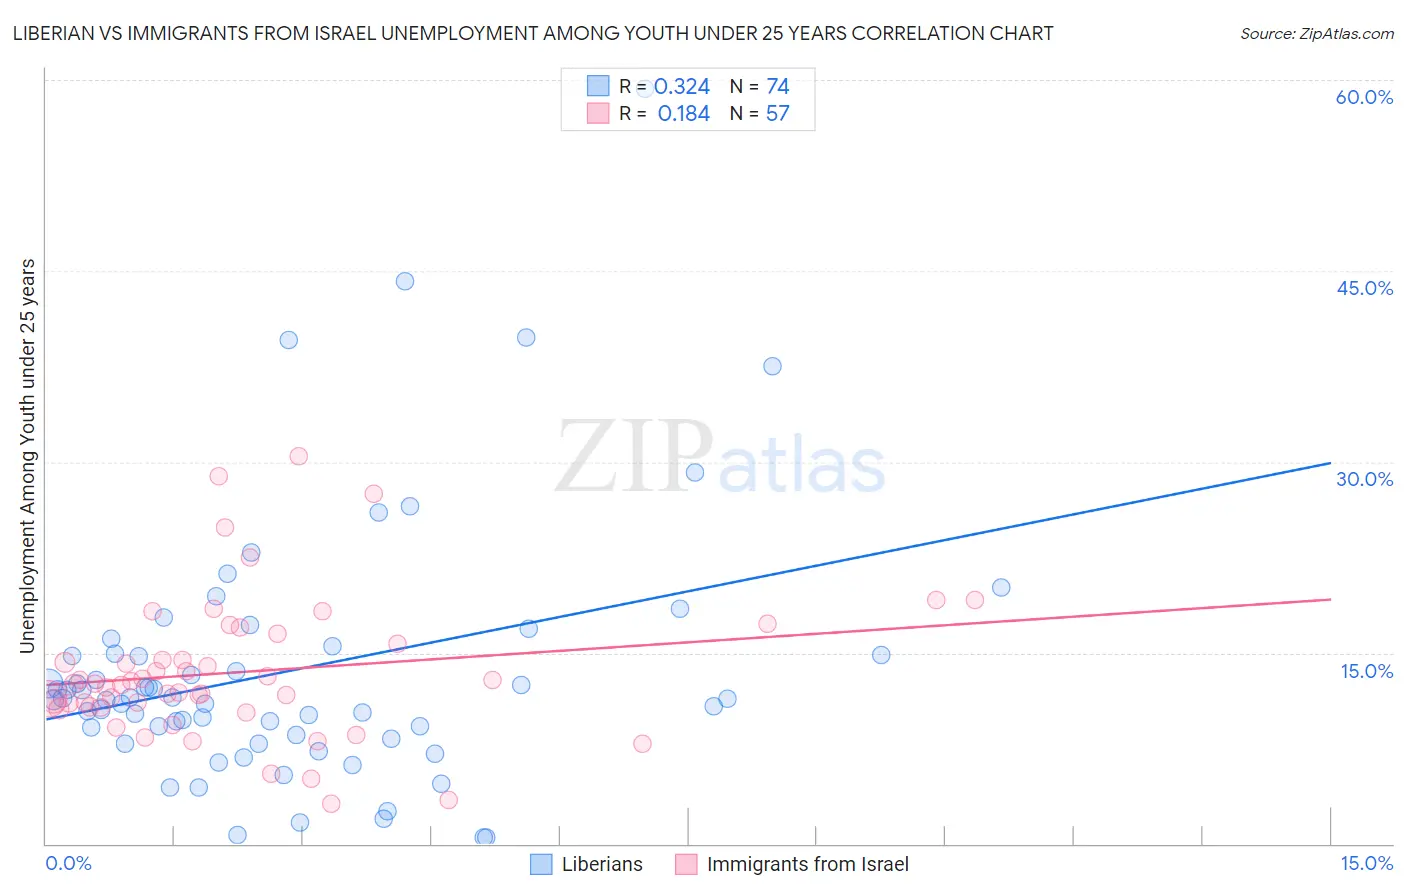
Liberian vs Immigrants from Israel Unemployment Among Youth under 25 years Correlation Chart
The statistical analysis conducted on geographies consisting of 117,784,061 people shows a mild positive correlation between the proportion of Liberians and unemployment rate among youth under the age of 25 in the United States with a correlation coefficient (R) of 0.324 and weighted average of 12.4%. Similarly, the statistical analysis conducted on geographies consisting of 208,849,337 people shows a poor positive correlation between the proportion of Immigrants from Israel and unemployment rate among youth under the age of 25 in the United States with a correlation coefficient (R) of 0.184 and weighted average of 12.0%, a difference of 2.8%.
Unemployment Among Youth under 25 years Correlation Summary
| Measurement | Liberian | Immigrants from Israel |
| Minimum | 0.50% | 3.1% |
| Maximum | 59.3% | 30.4% |
| Range | 58.8% | 27.3% |
| Mean | 13.6% | 13.5% |
| Median | 11.4% | 12.6% |
| Interquartile 25% (IQ1) | 8.5% | 10.7% |
| Interquartile 75% (IQ3) | 14.9% | 16.1% |
| Interquartile Range (IQR) | 6.4% | 5.3% |
| Standard Deviation (Sample) | 10.2% | 5.6% |
| Standard Deviation (Population) | 10.2% | 5.5% |
Similar Demographics by Unemployment Among Youth under 25 years
Demographics Similar to Liberians by Unemployment Among Youth under 25 years
In terms of unemployment among youth under 25 years, the demographic groups most similar to Liberians are Panamanian (12.4%, a difference of 0.010%), Salvadoran (12.4%, a difference of 0.040%), Hispanic or Latino (12.4%, a difference of 0.070%), Immigrants from Central America (12.4%, a difference of 0.10%), and Immigrants from Panama (12.4%, a difference of 0.39%).
| Demographics | Rating | Rank | Unemployment Among Youth under 25 years |
| Soviet Union | 0.6 /100 | #249 | Tragic 12.2% |
| Delaware | 0.4 /100 | #250 | Tragic 12.3% |
| Mexican American Indians | 0.4 /100 | #251 | Tragic 12.3% |
| Immigrants | Syria | 0.3 /100 | #252 | Tragic 12.3% |
| Mexicans | 0.3 /100 | #253 | Tragic 12.3% |
| Hondurans | 0.3 /100 | #254 | Tragic 12.3% |
| Hispanics or Latinos | 0.2 /100 | #255 | Tragic 12.4% |
| Liberians | 0.2 /100 | #256 | Tragic 12.4% |
| Panamanians | 0.2 /100 | #257 | Tragic 12.4% |
| Salvadorans | 0.1 /100 | #258 | Tragic 12.4% |
| Immigrants | Central America | 0.1 /100 | #259 | Tragic 12.4% |
| Immigrants | Panama | 0.1 /100 | #260 | Tragic 12.4% |
| Immigrants | El Salvador | 0.1 /100 | #261 | Tragic 12.4% |
| Immigrants | Mexico | 0.1 /100 | #262 | Tragic 12.4% |
| Cree | 0.1 /100 | #263 | Tragic 12.4% |
Demographics Similar to Immigrants from Israel by Unemployment Among Youth under 25 years
In terms of unemployment among youth under 25 years, the demographic groups most similar to Immigrants from Israel are Immigrants from Iran (12.0%, a difference of 0.020%), Immigrants from Ukraine (12.0%, a difference of 0.14%), Immigrants from Fiji (12.1%, a difference of 0.25%), Moroccan (12.1%, a difference of 0.26%), and Hawaiian (12.0%, a difference of 0.29%).
| Demographics | Rating | Rank | Unemployment Among Youth under 25 years |
| Immigrants | Nonimmigrants | 6.2 /100 | #219 | Tragic 11.9% |
| Alsatians | 6.1 /100 | #220 | Tragic 11.9% |
| Immigrants | Portugal | 4.9 /100 | #221 | Tragic 12.0% |
| Israelis | 4.1 /100 | #222 | Tragic 12.0% |
| Immigrants | Ireland | 3.5 /100 | #223 | Tragic 12.0% |
| Hawaiians | 3.5 /100 | #224 | Tragic 12.0% |
| Immigrants | Ukraine | 3.0 /100 | #225 | Tragic 12.0% |
| Immigrants | Israel | 2.6 /100 | #226 | Tragic 12.0% |
| Immigrants | Iran | 2.6 /100 | #227 | Tragic 12.0% |
| Immigrants | Fiji | 2.1 /100 | #228 | Tragic 12.1% |
| Moroccans | 2.1 /100 | #229 | Tragic 12.1% |
| Choctaw | 1.9 /100 | #230 | Tragic 12.1% |
| Immigrants | South America | 1.8 /100 | #231 | Tragic 12.1% |
| Immigrants | Belarus | 1.6 /100 | #232 | Tragic 12.1% |
| South American Indians | 1.6 /100 | #233 | Tragic 12.1% |