Liberian vs Immigrants from Israel Unemployment Among Women with Children Under 6 years
COMPARE
Liberian
Immigrants from Israel
Unemployment Among Women with Children Under 6 years
Unemployment Among Women with Children Under 6 years Comparison
Liberians
Immigrants from Israel
8.1%
UNEMPLOYMENT AMONG WOMEN WITH CHILDREN UNDER 6 YEARS
2.6/ 100
METRIC RATING
241st/ 347
METRIC RANK
6.5%
UNEMPLOYMENT AMONG WOMEN WITH CHILDREN UNDER 6 YEARS
100.0/ 100
METRIC RATING
28th/ 347
METRIC RANK
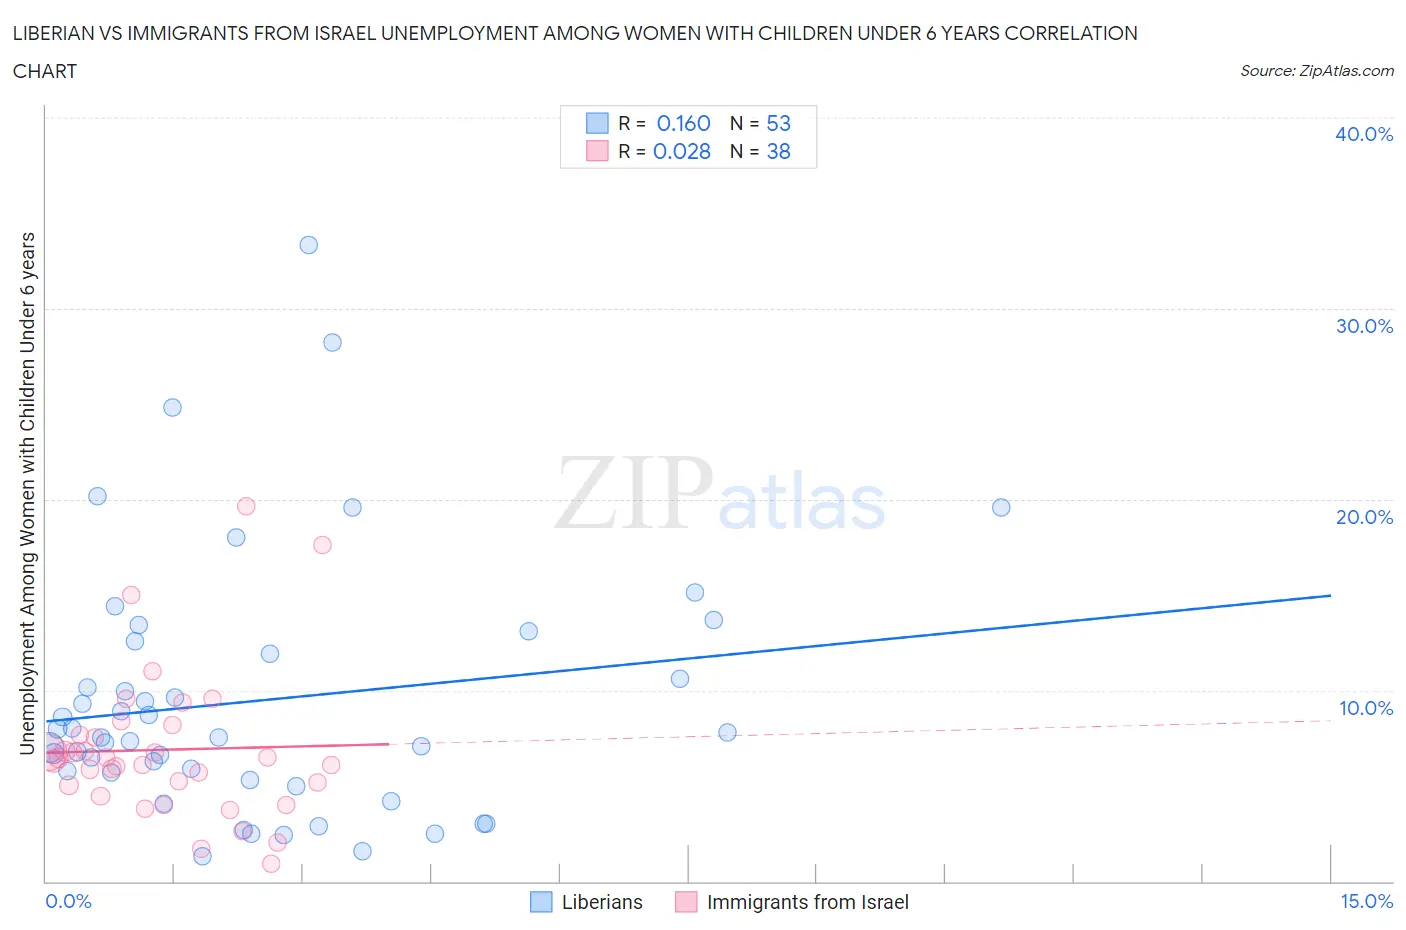
Liberian vs Immigrants from Israel Unemployment Among Women with Children Under 6 years Correlation Chart
The statistical analysis conducted on geographies consisting of 106,761,438 people shows a poor positive correlation between the proportion of Liberians and unemployment rate among women with children under the age of 6 in the United States with a correlation coefficient (R) of 0.160 and weighted average of 8.1%. Similarly, the statistical analysis conducted on geographies consisting of 175,300,948 people shows no correlation between the proportion of Immigrants from Israel and unemployment rate among women with children under the age of 6 in the United States with a correlation coefficient (R) of 0.028 and weighted average of 6.5%, a difference of 23.8%.
Unemployment Among Women with Children Under 6 years Correlation Summary
| Measurement | Liberian | Immigrants from Israel |
| Minimum | 1.3% | 0.90% |
| Maximum | 33.3% | 19.6% |
| Range | 32.0% | 18.7% |
| Mean | 9.5% | 6.9% |
| Median | 7.5% | 6.4% |
| Interquartile 25% (IQ1) | 5.5% | 5.0% |
| Interquartile 75% (IQ3) | 12.2% | 7.7% |
| Interquartile Range (IQR) | 6.7% | 2.6% |
| Standard Deviation (Sample) | 6.7% | 3.8% |
| Standard Deviation (Population) | 6.6% | 3.8% |
Similar Demographics by Unemployment Among Women with Children Under 6 years
Demographics Similar to Liberians by Unemployment Among Women with Children Under 6 years
In terms of unemployment among women with children under 6 years, the demographic groups most similar to Liberians are Immigrants from El Salvador (8.1%, a difference of 0.030%), Dutch (8.1%, a difference of 0.060%), Irish (8.1%, a difference of 0.10%), Immigrants from Middle Africa (8.1%, a difference of 0.36%), and Hawaiian (8.2%, a difference of 0.61%).
| Demographics | Rating | Rank | Unemployment Among Women with Children Under 6 years |
| Kiowa | 4.4 /100 | #234 | Tragic 8.0% |
| Comanche | 4.3 /100 | #235 | Tragic 8.0% |
| Immigrants | Barbados | 4.2 /100 | #236 | Tragic 8.0% |
| Immigrants | Costa Rica | 4.1 /100 | #237 | Tragic 8.0% |
| Immigrants | Middle Africa | 3.2 /100 | #238 | Tragic 8.1% |
| Irish | 2.7 /100 | #239 | Tragic 8.1% |
| Immigrants | El Salvador | 2.6 /100 | #240 | Tragic 8.1% |
| Liberians | 2.6 /100 | #241 | Tragic 8.1% |
| Dutch | 2.5 /100 | #242 | Tragic 8.1% |
| Hawaiians | 1.8 /100 | #243 | Tragic 8.2% |
| French | 1.7 /100 | #244 | Tragic 8.2% |
| Native Hawaiians | 1.7 /100 | #245 | Tragic 8.2% |
| Central Americans | 1.4 /100 | #246 | Tragic 8.2% |
| German Russians | 1.2 /100 | #247 | Tragic 8.2% |
| Immigrants | Western Africa | 1.1 /100 | #248 | Tragic 8.2% |
Demographics Similar to Immigrants from Israel by Unemployment Among Women with Children Under 6 years
In terms of unemployment among women with children under 6 years, the demographic groups most similar to Immigrants from Israel are Immigrants from Japan (6.5%, a difference of 0.020%), Cypriot (6.5%, a difference of 0.12%), Soviet Union (6.5%, a difference of 0.20%), Laotian (6.5%, a difference of 0.22%), and Immigrants from Sweden (6.6%, a difference of 0.26%).
| Demographics | Rating | Rank | Unemployment Among Women with Children Under 6 years |
| Burmese | 100.0 /100 | #21 | Exceptional 6.5% |
| Immigrants | Korea | 100.0 /100 | #22 | Exceptional 6.5% |
| Bulgarians | 100.0 /100 | #23 | Exceptional 6.5% |
| Laotians | 100.0 /100 | #24 | Exceptional 6.5% |
| Soviet Union | 100.0 /100 | #25 | Exceptional 6.5% |
| Cypriots | 100.0 /100 | #26 | Exceptional 6.5% |
| Immigrants | Japan | 100.0 /100 | #27 | Exceptional 6.5% |
| Immigrants | Israel | 100.0 /100 | #28 | Exceptional 6.5% |
| Immigrants | Sweden | 100.0 /100 | #29 | Exceptional 6.6% |
| Immigrants | Belarus | 100.0 /100 | #30 | Exceptional 6.6% |
| Immigrants | Moldova | 100.0 /100 | #31 | Exceptional 6.6% |
| Tsimshian | 100.0 /100 | #32 | Exceptional 6.6% |
| Immigrants | Vietnam | 100.0 /100 | #33 | Exceptional 6.6% |
| Immigrants | South Central Asia | 100.0 /100 | #34 | Exceptional 6.6% |
| Yakama | 100.0 /100 | #35 | Exceptional 6.6% |