Liberian vs Immigrants from Costa Rica GED/Equivalency
COMPARE
Liberian
Immigrants from Costa Rica
GED/Equivalency
GED/Equivalency Comparison
Liberians
Immigrants from Costa Rica
85.0%
GED/EQUIVALENCY
14.6/ 100
METRIC RATING
205th/ 347
METRIC RANK
84.5%
GED/EQUIVALENCY
5.4/ 100
METRIC RATING
227th/ 347
METRIC RANK
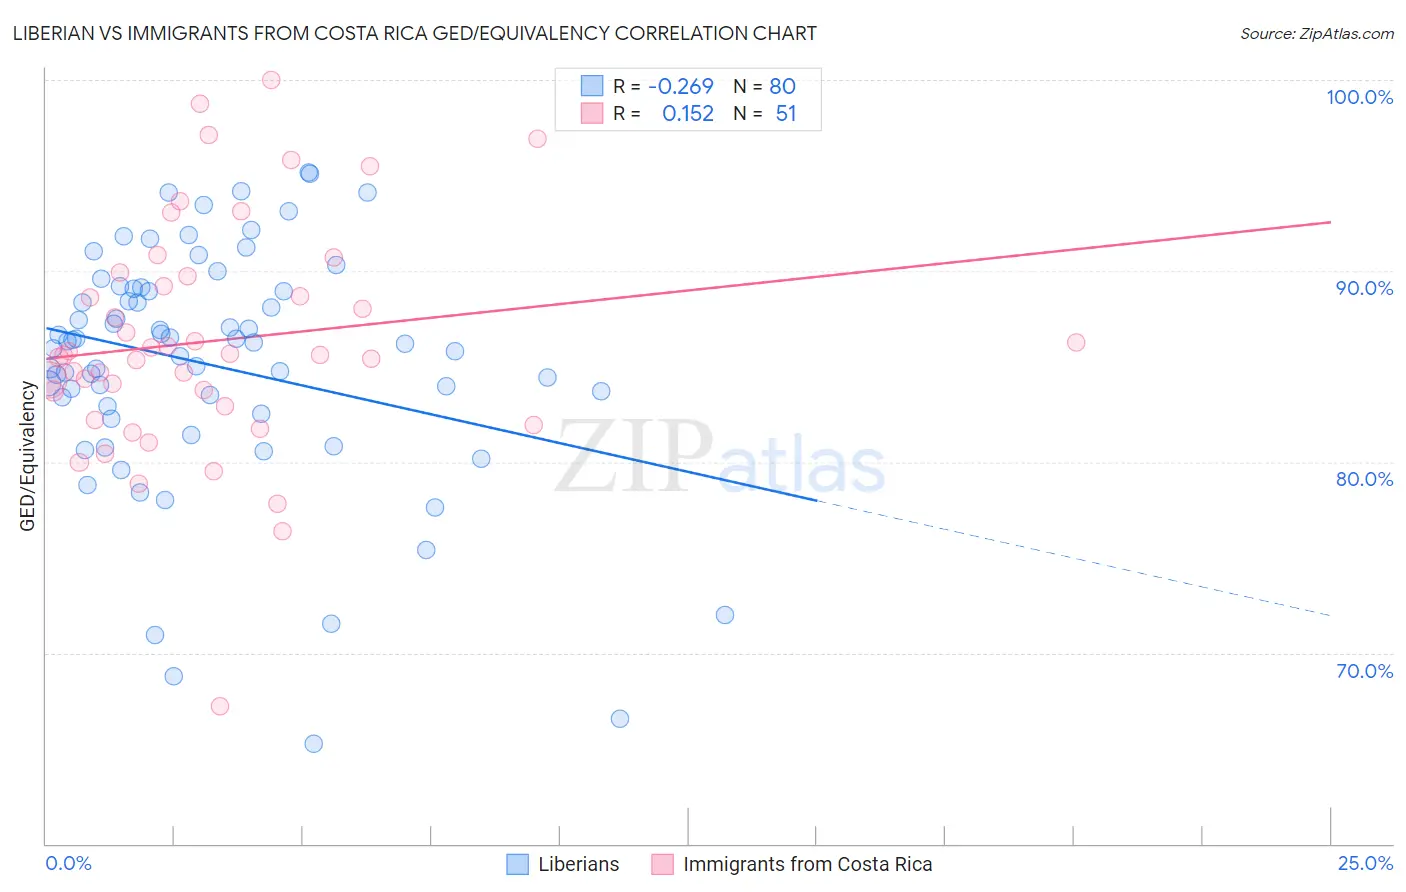
Liberian vs Immigrants from Costa Rica GED/Equivalency Correlation Chart
The statistical analysis conducted on geographies consisting of 118,103,458 people shows a weak negative correlation between the proportion of Liberians and percentage of population with at least ged/equivalency education in the United States with a correlation coefficient (R) of -0.269 and weighted average of 85.0%. Similarly, the statistical analysis conducted on geographies consisting of 204,277,241 people shows a poor positive correlation between the proportion of Immigrants from Costa Rica and percentage of population with at least ged/equivalency education in the United States with a correlation coefficient (R) of 0.152 and weighted average of 84.5%, a difference of 0.57%.
GED/Equivalency Correlation Summary
| Measurement | Liberian | Immigrants from Costa Rica |
| Minimum | 65.2% | 67.2% |
| Maximum | 95.2% | 100.0% |
| Range | 29.9% | 32.8% |
| Mean | 85.1% | 86.3% |
| Median | 86.2% | 85.6% |
| Interquartile 25% (IQ1) | 82.7% | 82.9% |
| Interquartile 75% (IQ3) | 89.0% | 89.7% |
| Interquartile Range (IQR) | 6.3% | 6.8% |
| Standard Deviation (Sample) | 6.3% | 6.1% |
| Standard Deviation (Population) | 6.3% | 6.0% |
Similar Demographics by GED/Equivalency
Demographics Similar to Liberians by GED/Equivalency
In terms of ged/equivalency, the demographic groups most similar to Liberians are Panamanian (85.0%, a difference of 0.030%), Hawaiian (85.0%, a difference of 0.030%), Samoan (84.9%, a difference of 0.040%), Portuguese (85.0%, a difference of 0.050%), and Cree (85.0%, a difference of 0.050%).
| Demographics | Rating | Rank | GED/Equivalency |
| Immigrants | Africa | 17.5 /100 | #198 | Poor 85.1% |
| Somalis | 16.4 /100 | #199 | Poor 85.0% |
| Uruguayans | 16.0 /100 | #200 | Poor 85.0% |
| Portuguese | 15.9 /100 | #201 | Poor 85.0% |
| Cree | 15.9 /100 | #202 | Poor 85.0% |
| Panamanians | 15.3 /100 | #203 | Poor 85.0% |
| Hawaiians | 15.2 /100 | #204 | Poor 85.0% |
| Liberians | 14.6 /100 | #205 | Poor 85.0% |
| Samoans | 13.7 /100 | #206 | Poor 84.9% |
| Hmong | 13.1 /100 | #207 | Poor 84.9% |
| Marshallese | 12.5 /100 | #208 | Poor 84.9% |
| Colombians | 12.3 /100 | #209 | Poor 84.9% |
| Immigrants | Cameroon | 12.1 /100 | #210 | Poor 84.9% |
| South Americans | 10.9 /100 | #211 | Poor 84.8% |
| Immigrants | Somalia | 10.6 /100 | #212 | Poor 84.8% |
Demographics Similar to Immigrants from Costa Rica by GED/Equivalency
In terms of ged/equivalency, the demographic groups most similar to Immigrants from Costa Rica are Immigrants from Zaire (84.5%, a difference of 0.010%), Immigrants from Thailand (84.5%, a difference of 0.040%), Immigrants from Liberia (84.4%, a difference of 0.050%), French American Indian (84.6%, a difference of 0.090%), and Immigrants from Uruguay (84.4%, a difference of 0.090%).
| Demographics | Rating | Rank | GED/Equivalency |
| Americans | 8.2 /100 | #220 | Tragic 84.7% |
| Taiwanese | 8.1 /100 | #221 | Tragic 84.7% |
| Iroquois | 7.5 /100 | #222 | Tragic 84.6% |
| Immigrants | Uzbekistan | 7.1 /100 | #223 | Tragic 84.6% |
| French American Indians | 6.3 /100 | #224 | Tragic 84.6% |
| Immigrants | Thailand | 5.8 /100 | #225 | Tragic 84.5% |
| Immigrants | Zaire | 5.5 /100 | #226 | Tragic 84.5% |
| Immigrants | Costa Rica | 5.4 /100 | #227 | Tragic 84.5% |
| Immigrants | Liberia | 4.9 /100 | #228 | Tragic 84.4% |
| Immigrants | Uruguay | 4.6 /100 | #229 | Tragic 84.4% |
| Immigrants | Colombia | 4.5 /100 | #230 | Tragic 84.4% |
| Immigrants | Middle Africa | 4.3 /100 | #231 | Tragic 84.4% |
| Immigrants | South America | 4.2 /100 | #232 | Tragic 84.4% |
| Immigrants | Panama | 4.1 /100 | #233 | Tragic 84.4% |
| Immigrants | Nigeria | 3.6 /100 | #234 | Tragic 84.3% |