Liberian vs Cypriot GED/Equivalency
COMPARE
Liberian
Cypriot
GED/Equivalency
GED/Equivalency Comparison
Liberians
Cypriots
85.0%
GED/EQUIVALENCY
14.6/ 100
METRIC RATING
205th/ 347
METRIC RANK
88.9%
GED/EQUIVALENCY
99.9/ 100
METRIC RATING
14th/ 347
METRIC RANK
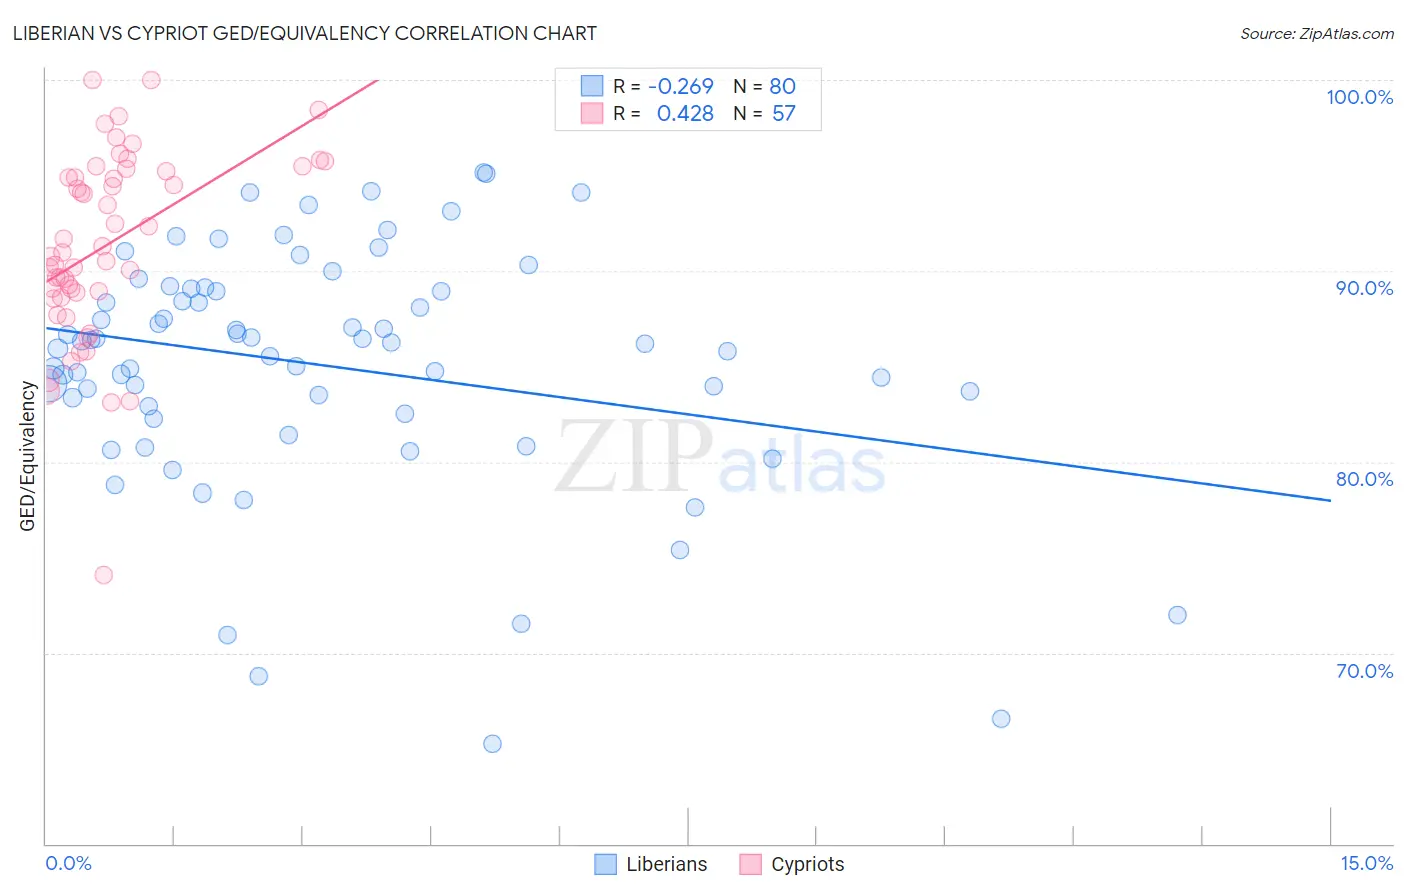
Liberian vs Cypriot GED/Equivalency Correlation Chart
The statistical analysis conducted on geographies consisting of 118,103,458 people shows a weak negative correlation between the proportion of Liberians and percentage of population with at least ged/equivalency education in the United States with a correlation coefficient (R) of -0.269 and weighted average of 85.0%. Similarly, the statistical analysis conducted on geographies consisting of 61,870,289 people shows a moderate positive correlation between the proportion of Cypriots and percentage of population with at least ged/equivalency education in the United States with a correlation coefficient (R) of 0.428 and weighted average of 88.9%, a difference of 4.6%.
GED/Equivalency Correlation Summary
| Measurement | Liberian | Cypriot |
| Minimum | 65.2% | 74.1% |
| Maximum | 95.2% | 100.0% |
| Range | 29.9% | 25.9% |
| Mean | 85.1% | 91.4% |
| Median | 86.2% | 90.9% |
| Interquartile 25% (IQ1) | 82.7% | 88.7% |
| Interquartile 75% (IQ3) | 89.0% | 95.3% |
| Interquartile Range (IQR) | 6.3% | 6.6% |
| Standard Deviation (Sample) | 6.3% | 4.9% |
| Standard Deviation (Population) | 6.3% | 4.9% |
Similar Demographics by GED/Equivalency
Demographics Similar to Liberians by GED/Equivalency
In terms of ged/equivalency, the demographic groups most similar to Liberians are Panamanian (85.0%, a difference of 0.030%), Hawaiian (85.0%, a difference of 0.030%), Samoan (84.9%, a difference of 0.040%), Portuguese (85.0%, a difference of 0.050%), and Cree (85.0%, a difference of 0.050%).
| Demographics | Rating | Rank | GED/Equivalency |
| Immigrants | Africa | 17.5 /100 | #198 | Poor 85.1% |
| Somalis | 16.4 /100 | #199 | Poor 85.0% |
| Uruguayans | 16.0 /100 | #200 | Poor 85.0% |
| Portuguese | 15.9 /100 | #201 | Poor 85.0% |
| Cree | 15.9 /100 | #202 | Poor 85.0% |
| Panamanians | 15.3 /100 | #203 | Poor 85.0% |
| Hawaiians | 15.2 /100 | #204 | Poor 85.0% |
| Liberians | 14.6 /100 | #205 | Poor 85.0% |
| Samoans | 13.7 /100 | #206 | Poor 84.9% |
| Hmong | 13.1 /100 | #207 | Poor 84.9% |
| Marshallese | 12.5 /100 | #208 | Poor 84.9% |
| Colombians | 12.3 /100 | #209 | Poor 84.9% |
| Immigrants | Cameroon | 12.1 /100 | #210 | Poor 84.9% |
| South Americans | 10.9 /100 | #211 | Poor 84.8% |
| Immigrants | Somalia | 10.6 /100 | #212 | Poor 84.8% |
Demographics Similar to Cypriots by GED/Equivalency
In terms of ged/equivalency, the demographic groups most similar to Cypriots are Okinawan (88.9%, a difference of 0.020%), Immigrants from Iran (88.9%, a difference of 0.030%), Lithuanian (88.9%, a difference of 0.040%), Immigrants from Taiwan (88.8%, a difference of 0.050%), and Bulgarian (89.0%, a difference of 0.080%).
| Demographics | Rating | Rank | GED/Equivalency |
| Eastern Europeans | 99.9 /100 | #7 | Exceptional 89.1% |
| Carpatho Rusyns | 99.9 /100 | #8 | Exceptional 89.1% |
| Chinese | 99.9 /100 | #9 | Exceptional 89.0% |
| Norwegians | 99.9 /100 | #10 | Exceptional 89.0% |
| Bulgarians | 99.9 /100 | #11 | Exceptional 89.0% |
| Lithuanians | 99.9 /100 | #12 | Exceptional 88.9% |
| Immigrants | Iran | 99.9 /100 | #13 | Exceptional 88.9% |
| Cypriots | 99.9 /100 | #14 | Exceptional 88.9% |
| Okinawans | 99.9 /100 | #15 | Exceptional 88.9% |
| Immigrants | Taiwan | 99.9 /100 | #16 | Exceptional 88.8% |
| Croatians | 99.9 /100 | #17 | Exceptional 88.8% |
| Slovenes | 99.9 /100 | #18 | Exceptional 88.8% |
| Swedes | 99.9 /100 | #19 | Exceptional 88.8% |
| Maltese | 99.9 /100 | #20 | Exceptional 88.6% |
| Luxembourgers | 99.8 /100 | #21 | Exceptional 88.6% |