Immigrants from Indonesia vs Immigrants from Greece Bachelor's Degree
COMPARE
Immigrants from Indonesia
Immigrants from Greece
Bachelor's Degree
Bachelor's Degree Comparison
Immigrants from Indonesia
Immigrants from Greece
43.3%
BACHELOR'S DEGREE
99.7/ 100
METRIC RATING
68th/ 347
METRIC RANK
44.5%
BACHELOR'S DEGREE
99.9/ 100
METRIC RATING
50th/ 347
METRIC RANK
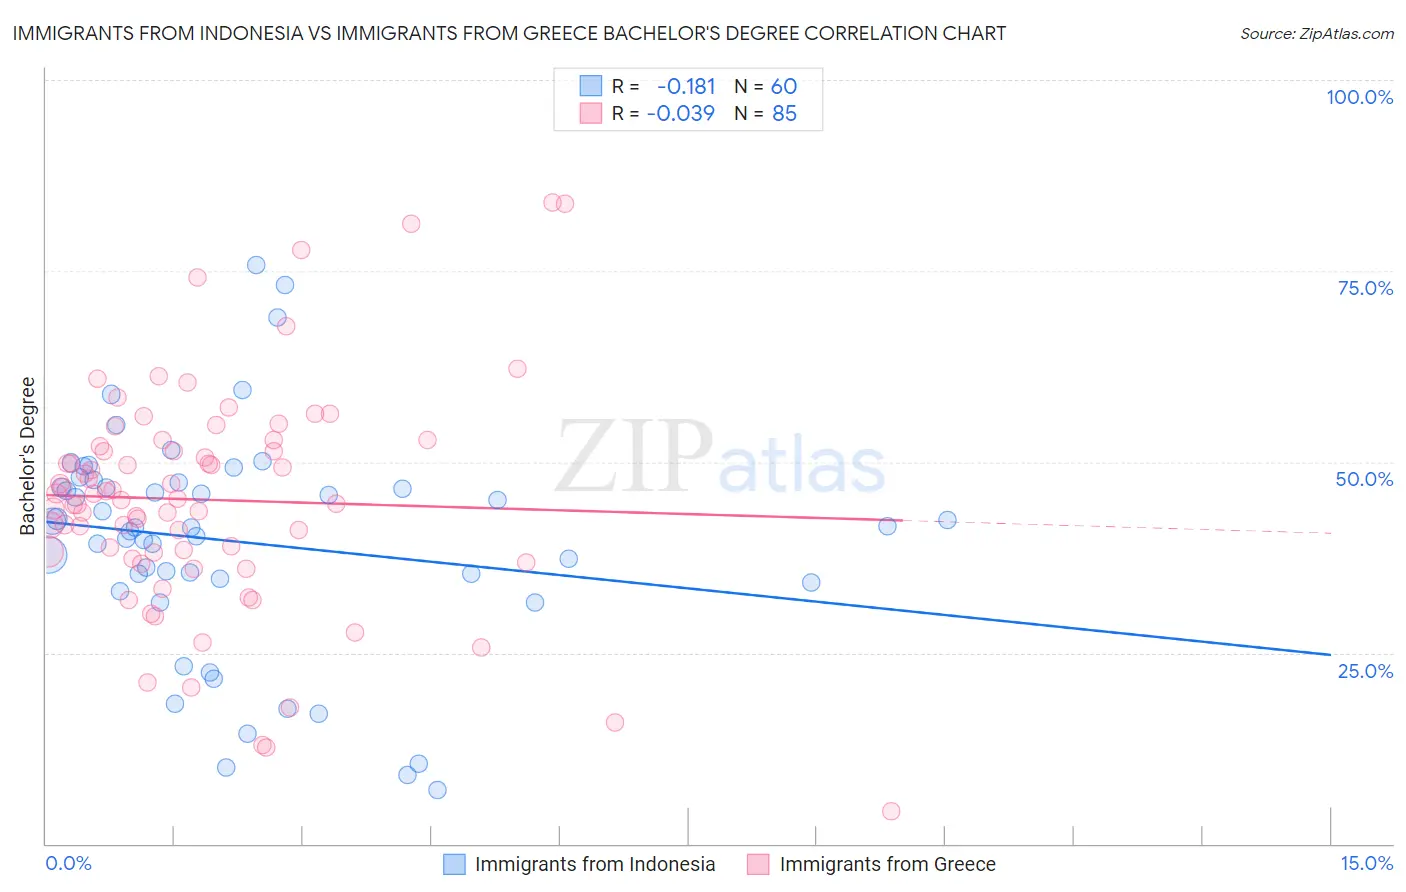
Immigrants from Indonesia vs Immigrants from Greece Bachelor's Degree Correlation Chart
The statistical analysis conducted on geographies consisting of 215,775,371 people shows a poor negative correlation between the proportion of Immigrants from Indonesia and percentage of population with at least bachelor's degree education in the United States with a correlation coefficient (R) of -0.181 and weighted average of 43.3%. Similarly, the statistical analysis conducted on geographies consisting of 216,876,242 people shows no correlation between the proportion of Immigrants from Greece and percentage of population with at least bachelor's degree education in the United States with a correlation coefficient (R) of -0.039 and weighted average of 44.5%, a difference of 2.8%.
Bachelor's Degree Correlation Summary
| Measurement | Immigrants from Indonesia | Immigrants from Greece |
| Minimum | 7.0% | 4.3% |
| Maximum | 75.7% | 83.9% |
| Range | 68.7% | 79.6% |
| Mean | 39.5% | 45.0% |
| Median | 41.4% | 45.2% |
| Interquartile 25% (IQ1) | 34.4% | 37.8% |
| Interquartile 75% (IQ3) | 47.0% | 52.4% |
| Interquartile Range (IQR) | 12.6% | 14.6% |
| Standard Deviation (Sample) | 14.6% | 14.9% |
| Standard Deviation (Population) | 14.5% | 14.8% |
Demographics Similar to Immigrants from Indonesia and Immigrants from Greece by Bachelor's Degree
In terms of bachelor's degree, the demographic groups most similar to Immigrants from Indonesia are Egyptian (43.3%, a difference of 0.020%), Immigrants from Netherlands (43.3%, a difference of 0.040%), Zimbabwean (43.3%, a difference of 0.060%), Argentinean (43.3%, a difference of 0.070%), and Immigrants from Pakistan (43.1%, a difference of 0.26%). Similarly, the demographic groups most similar to Immigrants from Greece are Immigrants from Norway (44.5%, a difference of 0.12%), Asian (44.4%, a difference of 0.14%), Immigrants from Spain (44.3%, a difference of 0.32%), Immigrants from Asia (44.3%, a difference of 0.38%), and Immigrants from Austria (44.2%, a difference of 0.56%).
| Demographics | Rating | Rank | Bachelor's Degree |
| Immigrants | Norway | 99.9 /100 | #49 | Exceptional 44.5% |
| Immigrants | Greece | 99.9 /100 | #50 | Exceptional 44.5% |
| Asians | 99.9 /100 | #51 | Exceptional 44.4% |
| Immigrants | Spain | 99.9 /100 | #52 | Exceptional 44.3% |
| Immigrants | Asia | 99.9 /100 | #53 | Exceptional 44.3% |
| Immigrants | Austria | 99.9 /100 | #54 | Exceptional 44.2% |
| Immigrants | Bolivia | 99.9 /100 | #55 | Exceptional 44.2% |
| Immigrants | Serbia | 99.9 /100 | #56 | Exceptional 44.1% |
| Paraguayans | 99.9 /100 | #57 | Exceptional 44.0% |
| Immigrants | Czechoslovakia | 99.9 /100 | #58 | Exceptional 44.0% |
| Australians | 99.9 /100 | #59 | Exceptional 44.0% |
| New Zealanders | 99.9 /100 | #60 | Exceptional 44.0% |
| South Africans | 99.8 /100 | #61 | Exceptional 43.6% |
| Immigrants | Kazakhstan | 99.8 /100 | #62 | Exceptional 43.4% |
| Immigrants | Europe | 99.8 /100 | #63 | Exceptional 43.4% |
| Argentineans | 99.7 /100 | #64 | Exceptional 43.3% |
| Zimbabweans | 99.7 /100 | #65 | Exceptional 43.3% |
| Immigrants | Netherlands | 99.7 /100 | #66 | Exceptional 43.3% |
| Egyptians | 99.7 /100 | #67 | Exceptional 43.3% |
| Immigrants | Indonesia | 99.7 /100 | #68 | Exceptional 43.3% |
| Immigrants | Pakistan | 99.7 /100 | #69 | Exceptional 43.1% |