Yup'ik vs Immigrants from Greece Bachelor's Degree
COMPARE
Yup'ik
Immigrants from Greece
Bachelor's Degree
Bachelor's Degree Comparison
Yup'ik
Immigrants from Greece
19.4%
BACHELOR'S DEGREE
0.0/ 100
METRIC RATING
347th/ 347
METRIC RANK
44.5%
BACHELOR'S DEGREE
99.9/ 100
METRIC RATING
50th/ 347
METRIC RANK
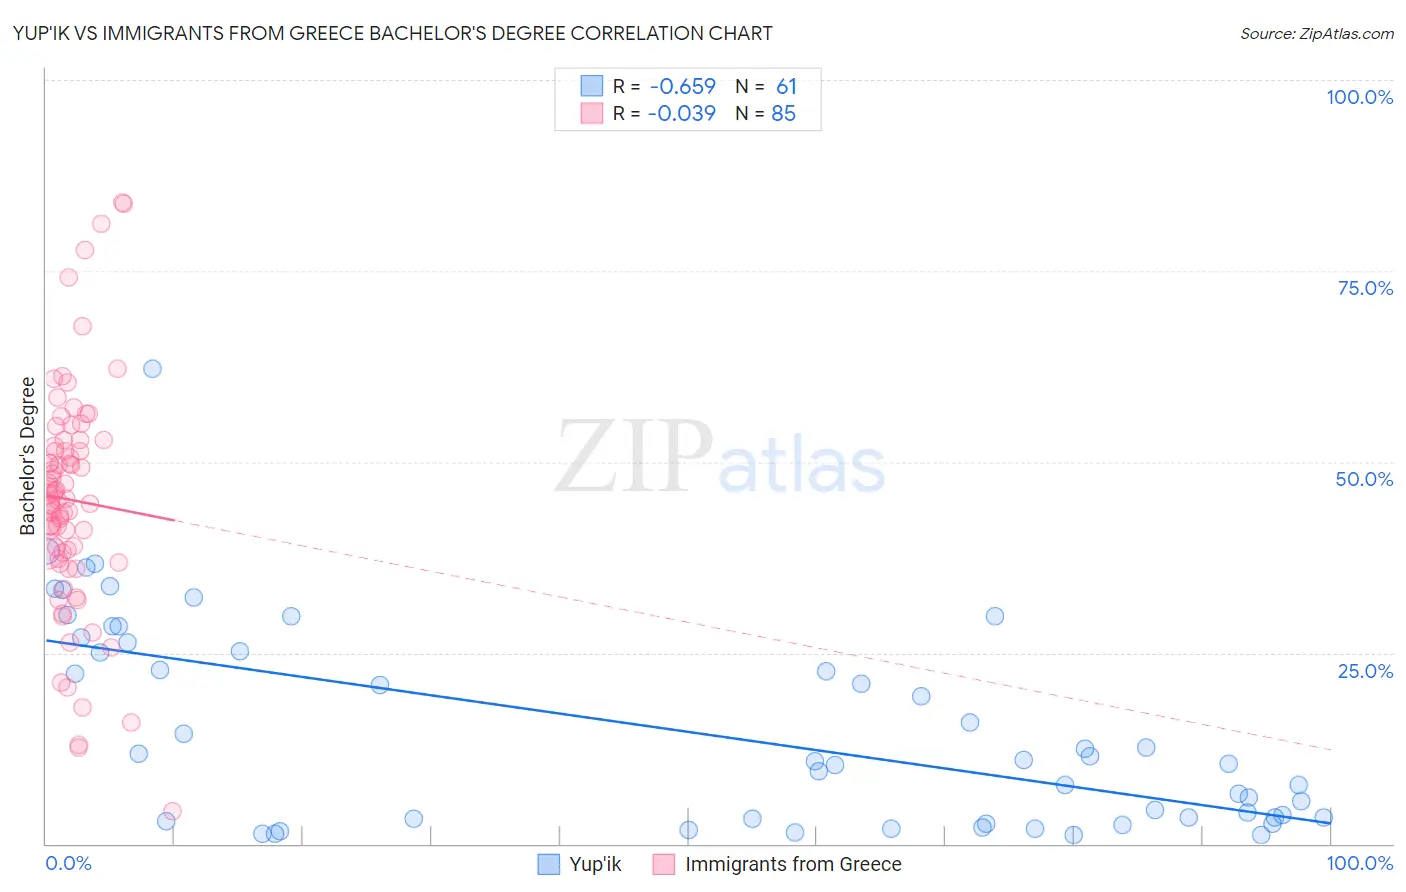
Yup'ik vs Immigrants from Greece Bachelor's Degree Correlation Chart
The statistical analysis conducted on geographies consisting of 39,961,864 people shows a significant negative correlation between the proportion of Yup'ik and percentage of population with at least bachelor's degree education in the United States with a correlation coefficient (R) of -0.659 and weighted average of 19.4%. Similarly, the statistical analysis conducted on geographies consisting of 216,876,242 people shows no correlation between the proportion of Immigrants from Greece and percentage of population with at least bachelor's degree education in the United States with a correlation coefficient (R) of -0.039 and weighted average of 44.5%, a difference of 129.0%.
Bachelor's Degree Correlation Summary
| Measurement | Yup'ik | Immigrants from Greece |
| Minimum | 1.2% | 4.3% |
| Maximum | 62.1% | 83.9% |
| Range | 60.9% | 79.6% |
| Mean | 14.8% | 45.0% |
| Median | 10.9% | 45.2% |
| Interquartile 25% (IQ1) | 3.2% | 37.8% |
| Interquartile 75% (IQ3) | 25.8% | 52.4% |
| Interquartile Range (IQR) | 22.6% | 14.6% |
| Standard Deviation (Sample) | 13.3% | 14.9% |
| Standard Deviation (Population) | 13.2% | 14.8% |
Similar Demographics by Bachelor's Degree
Demographics Similar to Yup'ik by Bachelor's Degree
In terms of bachelor's degree, the demographic groups most similar to Yup'ik are Houma (21.4%, a difference of 10.4%), Pima (23.2%, a difference of 19.5%), Navajo (23.6%, a difference of 21.6%), Tohono O'odham (24.4%, a difference of 25.8%), and Yakama (24.5%, a difference of 26.0%).
| Demographics | Rating | Rank | Bachelor's Degree |
| Mexicans | 0.0 /100 | #333 | Tragic 27.1% |
| Arapaho | 0.0 /100 | #334 | Tragic 26.6% |
| Natives/Alaskans | 0.0 /100 | #335 | Tragic 26.3% |
| Immigrants | Mexico | 0.0 /100 | #336 | Tragic 26.1% |
| Inupiat | 0.0 /100 | #337 | Tragic 25.8% |
| Pueblo | 0.0 /100 | #338 | Tragic 25.5% |
| Hopi | 0.0 /100 | #339 | Tragic 25.3% |
| Lumbee | 0.0 /100 | #340 | Tragic 24.8% |
| Yuman | 0.0 /100 | #341 | Tragic 24.5% |
| Yakama | 0.0 /100 | #342 | Tragic 24.5% |
| Tohono O'odham | 0.0 /100 | #343 | Tragic 24.4% |
| Navajo | 0.0 /100 | #344 | Tragic 23.6% |
| Pima | 0.0 /100 | #345 | Tragic 23.2% |
| Houma | 0.0 /100 | #346 | Tragic 21.4% |
| Yup'ik | 0.0 /100 | #347 | Tragic 19.4% |
Demographics Similar to Immigrants from Greece by Bachelor's Degree
In terms of bachelor's degree, the demographic groups most similar to Immigrants from Greece are Immigrants from Norway (44.5%, a difference of 0.12%), Asian (44.4%, a difference of 0.14%), Bolivian (44.6%, a difference of 0.24%), Estonian (44.6%, a difference of 0.24%), and Immigrants from Bulgaria (44.6%, a difference of 0.28%).
| Demographics | Rating | Rank | Bachelor's Degree |
| Immigrants | South Africa | 99.9 /100 | #43 | Exceptional 44.8% |
| Immigrants | Lithuania | 99.9 /100 | #44 | Exceptional 44.6% |
| Immigrants | Kuwait | 99.9 /100 | #45 | Exceptional 44.6% |
| Immigrants | Bulgaria | 99.9 /100 | #46 | Exceptional 44.6% |
| Bolivians | 99.9 /100 | #47 | Exceptional 44.6% |
| Estonians | 99.9 /100 | #48 | Exceptional 44.6% |
| Immigrants | Norway | 99.9 /100 | #49 | Exceptional 44.5% |
| Immigrants | Greece | 99.9 /100 | #50 | Exceptional 44.5% |
| Asians | 99.9 /100 | #51 | Exceptional 44.4% |
| Immigrants | Spain | 99.9 /100 | #52 | Exceptional 44.3% |
| Immigrants | Asia | 99.9 /100 | #53 | Exceptional 44.3% |
| Immigrants | Austria | 99.9 /100 | #54 | Exceptional 44.2% |
| Immigrants | Bolivia | 99.9 /100 | #55 | Exceptional 44.2% |
| Immigrants | Serbia | 99.9 /100 | #56 | Exceptional 44.1% |
| Paraguayans | 99.9 /100 | #57 | Exceptional 44.0% |