Liberian vs Russian Professional Degree
COMPARE
Liberian
Russian
Professional Degree
Professional Degree Comparison
Liberians
Russians
3.6%
PROFESSIONAL DEGREE
0.5/ 100
METRIC RATING
276th/ 347
METRIC RANK
6.3%
PROFESSIONAL DEGREE
100.0/ 100
METRIC RATING
23rd/ 347
METRIC RANK
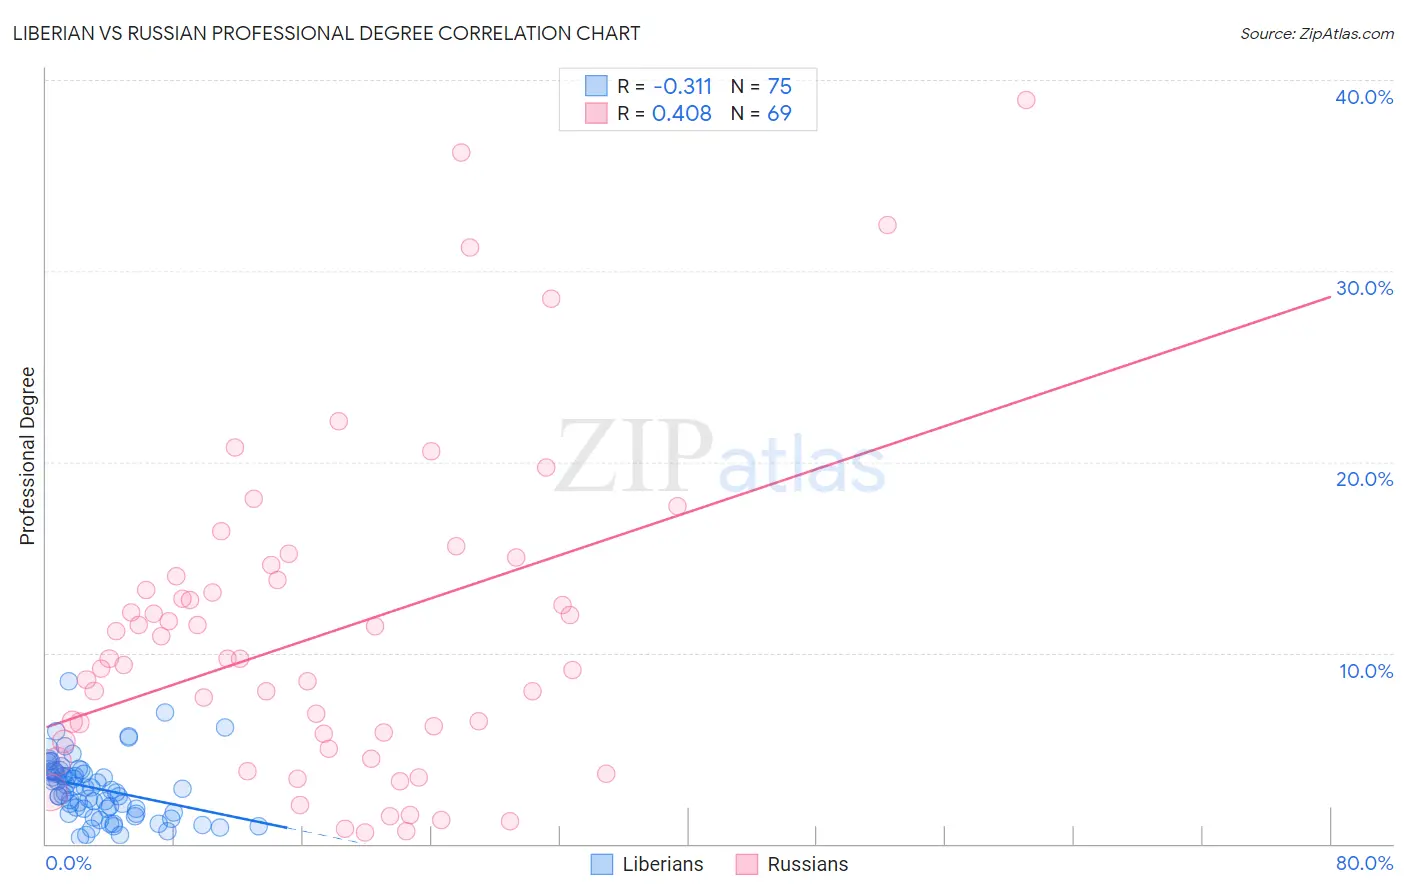
Liberian vs Russian Professional Degree Correlation Chart
The statistical analysis conducted on geographies consisting of 117,941,180 people shows a mild negative correlation between the proportion of Liberians and percentage of population with at least professional degree education in the United States with a correlation coefficient (R) of -0.311 and weighted average of 3.6%. Similarly, the statistical analysis conducted on geographies consisting of 509,341,332 people shows a moderate positive correlation between the proportion of Russians and percentage of population with at least professional degree education in the United States with a correlation coefficient (R) of 0.408 and weighted average of 6.3%, a difference of 78.3%.
Professional Degree Correlation Summary
| Measurement | Liberian | Russian |
| Minimum | 0.33% | 0.56% |
| Maximum | 8.5% | 39.0% |
| Range | 8.2% | 38.4% |
| Mean | 2.9% | 11.0% |
| Median | 2.8% | 9.7% |
| Interquartile 25% (IQ1) | 1.7% | 5.2% |
| Interquartile 75% (IQ3) | 3.8% | 13.9% |
| Interquartile Range (IQR) | 2.1% | 8.7% |
| Standard Deviation (Sample) | 1.6% | 8.3% |
| Standard Deviation (Population) | 1.6% | 8.3% |
Similar Demographics by Professional Degree
Demographics Similar to Liberians by Professional Degree
In terms of professional degree, the demographic groups most similar to Liberians are Cheyenne (3.6%, a difference of 0.010%), Immigrants from Dominica (3.6%, a difference of 0.050%), Japanese (3.5%, a difference of 0.070%), Immigrants from Portugal (3.5%, a difference of 0.11%), and Dominican (3.5%, a difference of 0.15%).
| Demographics | Rating | Rank | Professional Degree |
| Immigrants | Cuba | 0.6 /100 | #269 | Tragic 3.6% |
| Central Americans | 0.6 /100 | #270 | Tragic 3.6% |
| Belizeans | 0.5 /100 | #271 | Tragic 3.6% |
| Immigrants | Jamaica | 0.5 /100 | #272 | Tragic 3.6% |
| Americans | 0.5 /100 | #273 | Tragic 3.6% |
| Potawatomi | 0.5 /100 | #274 | Tragic 3.6% |
| Immigrants | Dominica | 0.5 /100 | #275 | Tragic 3.6% |
| Liberians | 0.5 /100 | #276 | Tragic 3.6% |
| Cheyenne | 0.5 /100 | #277 | Tragic 3.6% |
| Japanese | 0.5 /100 | #278 | Tragic 3.5% |
| Immigrants | Portugal | 0.5 /100 | #279 | Tragic 3.5% |
| Dominicans | 0.5 /100 | #280 | Tragic 3.5% |
| Apache | 0.5 /100 | #281 | Tragic 3.5% |
| Immigrants | Caribbean | 0.5 /100 | #282 | Tragic 3.5% |
| Comanche | 0.4 /100 | #283 | Tragic 3.5% |
Demographics Similar to Russians by Professional Degree
In terms of professional degree, the demographic groups most similar to Russians are Immigrants from Spain (6.3%, a difference of 0.040%), Immigrants from Japan (6.4%, a difference of 0.48%), Immigrants from Ireland (6.3%, a difference of 0.53%), Immigrants from Hong Kong (6.4%, a difference of 1.2%), and Latvian (6.2%, a difference of 1.4%).
| Demographics | Rating | Rank | Professional Degree |
| Immigrants | Sweden | 100.0 /100 | #16 | Exceptional 6.7% |
| Immigrants | Eastern Asia | 100.0 /100 | #17 | Exceptional 6.6% |
| Soviet Union | 100.0 /100 | #18 | Exceptional 6.6% |
| Indians (Asian) | 100.0 /100 | #19 | Exceptional 6.5% |
| Immigrants | Denmark | 100.0 /100 | #20 | Exceptional 6.4% |
| Immigrants | Hong Kong | 100.0 /100 | #21 | Exceptional 6.4% |
| Immigrants | Japan | 100.0 /100 | #22 | Exceptional 6.4% |
| Russians | 100.0 /100 | #23 | Exceptional 6.3% |
| Immigrants | Spain | 100.0 /100 | #24 | Exceptional 6.3% |
| Immigrants | Ireland | 100.0 /100 | #25 | Exceptional 6.3% |
| Latvians | 100.0 /100 | #26 | Exceptional 6.2% |
| Immigrants | Northern Europe | 100.0 /100 | #27 | Exceptional 6.2% |
| Turks | 100.0 /100 | #28 | Exceptional 6.2% |
| Immigrants | Sri Lanka | 100.0 /100 | #29 | Exceptional 6.2% |
| Immigrants | Turkey | 100.0 /100 | #30 | Exceptional 6.2% |