Liberian vs Venezuelan Professional Degree
COMPARE
Liberian
Venezuelan
Professional Degree
Professional Degree Comparison
Liberians
Venezuelans
3.6%
PROFESSIONAL DEGREE
0.5/ 100
METRIC RATING
276th/ 347
METRIC RANK
4.9%
PROFESSIONAL DEGREE
96.3/ 100
METRIC RATING
116th/ 347
METRIC RANK
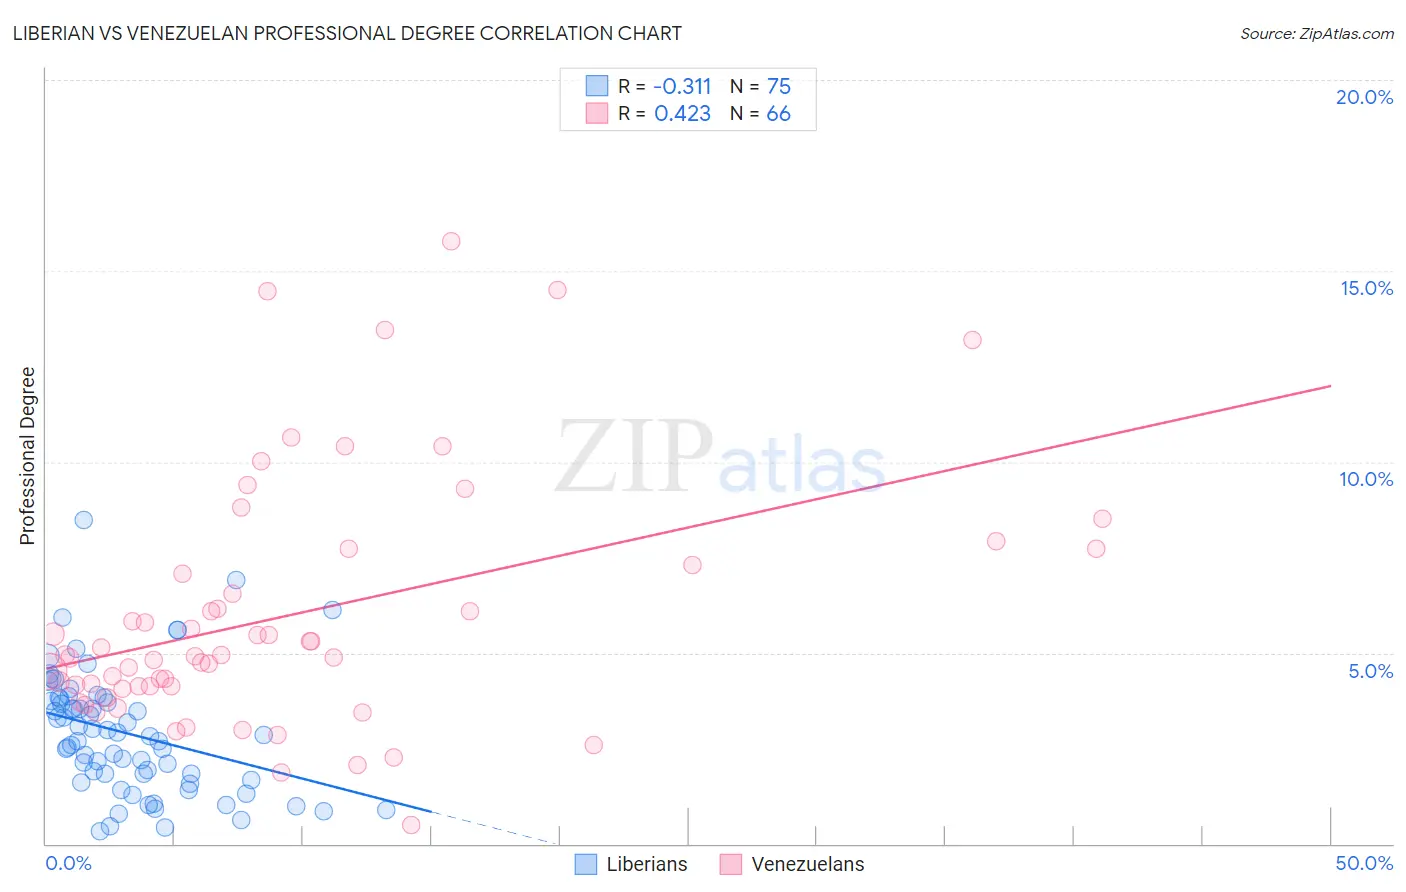
Liberian vs Venezuelan Professional Degree Correlation Chart
The statistical analysis conducted on geographies consisting of 117,941,180 people shows a mild negative correlation between the proportion of Liberians and percentage of population with at least professional degree education in the United States with a correlation coefficient (R) of -0.311 and weighted average of 3.6%. Similarly, the statistical analysis conducted on geographies consisting of 305,937,617 people shows a moderate positive correlation between the proportion of Venezuelans and percentage of population with at least professional degree education in the United States with a correlation coefficient (R) of 0.423 and weighted average of 4.9%, a difference of 38.8%.
Professional Degree Correlation Summary
| Measurement | Liberian | Venezuelan |
| Minimum | 0.33% | 0.50% |
| Maximum | 8.5% | 15.8% |
| Range | 8.2% | 15.3% |
| Mean | 2.9% | 6.0% |
| Median | 2.8% | 4.9% |
| Interquartile 25% (IQ1) | 1.7% | 4.1% |
| Interquartile 75% (IQ3) | 3.8% | 7.3% |
| Interquartile Range (IQR) | 2.1% | 3.2% |
| Standard Deviation (Sample) | 1.6% | 3.2% |
| Standard Deviation (Population) | 1.6% | 3.2% |
Similar Demographics by Professional Degree
Demographics Similar to Liberians by Professional Degree
In terms of professional degree, the demographic groups most similar to Liberians are Cheyenne (3.6%, a difference of 0.010%), Immigrants from Dominica (3.6%, a difference of 0.050%), Japanese (3.5%, a difference of 0.070%), Immigrants from Portugal (3.5%, a difference of 0.11%), and Dominican (3.5%, a difference of 0.15%).
| Demographics | Rating | Rank | Professional Degree |
| Immigrants | Cuba | 0.6 /100 | #269 | Tragic 3.6% |
| Central Americans | 0.6 /100 | #270 | Tragic 3.6% |
| Belizeans | 0.5 /100 | #271 | Tragic 3.6% |
| Immigrants | Jamaica | 0.5 /100 | #272 | Tragic 3.6% |
| Americans | 0.5 /100 | #273 | Tragic 3.6% |
| Potawatomi | 0.5 /100 | #274 | Tragic 3.6% |
| Immigrants | Dominica | 0.5 /100 | #275 | Tragic 3.6% |
| Liberians | 0.5 /100 | #276 | Tragic 3.6% |
| Cheyenne | 0.5 /100 | #277 | Tragic 3.6% |
| Japanese | 0.5 /100 | #278 | Tragic 3.5% |
| Immigrants | Portugal | 0.5 /100 | #279 | Tragic 3.5% |
| Dominicans | 0.5 /100 | #280 | Tragic 3.5% |
| Apache | 0.5 /100 | #281 | Tragic 3.5% |
| Immigrants | Caribbean | 0.5 /100 | #282 | Tragic 3.5% |
| Comanche | 0.4 /100 | #283 | Tragic 3.5% |
Demographics Similar to Venezuelans by Professional Degree
In terms of professional degree, the demographic groups most similar to Venezuelans are Immigrants from Syria (4.9%, a difference of 0.21%), Croatian (4.9%, a difference of 0.21%), Moroccan (5.0%, a difference of 0.47%), Immigrants from Morocco (5.0%, a difference of 0.57%), and Immigrants from Sudan (4.9%, a difference of 0.75%).
| Demographics | Rating | Rank | Professional Degree |
| British | 98.0 /100 | #109 | Exceptional 5.0% |
| Lebanese | 98.0 /100 | #110 | Exceptional 5.0% |
| Brazilians | 97.4 /100 | #111 | Exceptional 5.0% |
| Taiwanese | 97.3 /100 | #112 | Exceptional 5.0% |
| Immigrants | Pakistan | 97.2 /100 | #113 | Exceptional 5.0% |
| Immigrants | Morocco | 96.8 /100 | #114 | Exceptional 5.0% |
| Moroccans | 96.8 /100 | #115 | Exceptional 5.0% |
| Venezuelans | 96.3 /100 | #116 | Exceptional 4.9% |
| Immigrants | Syria | 96.0 /100 | #117 | Exceptional 4.9% |
| Croatians | 96.0 /100 | #118 | Exceptional 4.9% |
| Immigrants | Sudan | 95.4 /100 | #119 | Exceptional 4.9% |
| Albanians | 95.3 /100 | #120 | Exceptional 4.9% |
| Immigrants | Moldova | 94.8 /100 | #121 | Exceptional 4.9% |
| Immigrants | Germany | 94.1 /100 | #122 | Exceptional 4.9% |
| Immigrants | Venezuela | 93.8 /100 | #123 | Exceptional 4.8% |