Immigrants from Nicaragua vs Cypriot GED/Equivalency
COMPARE
Immigrants from Nicaragua
Cypriot
GED/Equivalency
GED/Equivalency Comparison
Immigrants from Nicaragua
Cypriots
79.9%
GED/EQUIVALENCY
0.0/ 100
METRIC RATING
323rd/ 347
METRIC RANK
88.9%
GED/EQUIVALENCY
99.9/ 100
METRIC RATING
14th/ 347
METRIC RANK
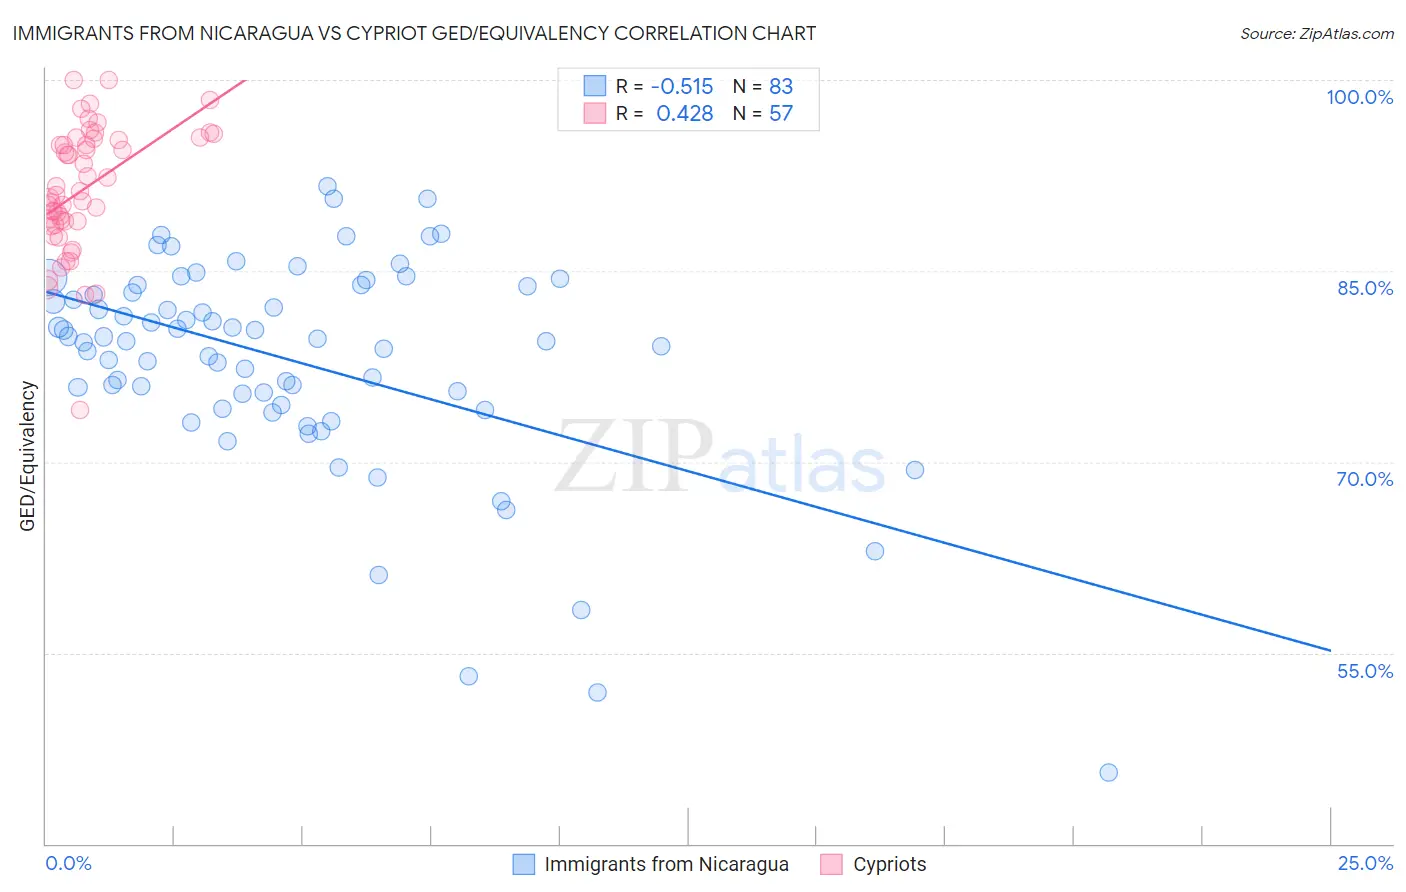
Immigrants from Nicaragua vs Cypriot GED/Equivalency Correlation Chart
The statistical analysis conducted on geographies consisting of 236,340,156 people shows a substantial negative correlation between the proportion of Immigrants from Nicaragua and percentage of population with at least ged/equivalency education in the United States with a correlation coefficient (R) of -0.515 and weighted average of 79.9%. Similarly, the statistical analysis conducted on geographies consisting of 61,870,289 people shows a moderate positive correlation between the proportion of Cypriots and percentage of population with at least ged/equivalency education in the United States with a correlation coefficient (R) of 0.428 and weighted average of 88.9%, a difference of 11.3%.
GED/Equivalency Correlation Summary
| Measurement | Immigrants from Nicaragua | Cypriot |
| Minimum | 45.6% | 74.1% |
| Maximum | 91.7% | 100.0% |
| Range | 46.1% | 25.9% |
| Mean | 77.9% | 91.4% |
| Median | 79.5% | 90.9% |
| Interquartile 25% (IQ1) | 74.4% | 88.7% |
| Interquartile 75% (IQ3) | 83.8% | 95.3% |
| Interquartile Range (IQR) | 9.3% | 6.6% |
| Standard Deviation (Sample) | 8.4% | 4.9% |
| Standard Deviation (Population) | 8.4% | 4.9% |
Similar Demographics by GED/Equivalency
Demographics Similar to Immigrants from Nicaragua by GED/Equivalency
In terms of ged/equivalency, the demographic groups most similar to Immigrants from Nicaragua are Lumbee (80.0%, a difference of 0.12%), Yup'ik (80.0%, a difference of 0.19%), Immigrants from Cuba (80.2%, a difference of 0.36%), Mexican American Indian (79.4%, a difference of 0.65%), and Honduran (79.3%, a difference of 0.76%).
| Demographics | Rating | Rank | GED/Equivalency |
| Central American Indians | 0.0 /100 | #316 | Tragic 80.6% |
| Immigrants | Caribbean | 0.0 /100 | #317 | Tragic 80.5% |
| Yaqui | 0.0 /100 | #318 | Tragic 80.5% |
| Immigrants | Belize | 0.0 /100 | #319 | Tragic 80.5% |
| Immigrants | Cuba | 0.0 /100 | #320 | Tragic 80.2% |
| Yup'ik | 0.0 /100 | #321 | Tragic 80.0% |
| Lumbee | 0.0 /100 | #322 | Tragic 80.0% |
| Immigrants | Nicaragua | 0.0 /100 | #323 | Tragic 79.9% |
| Mexican American Indians | 0.0 /100 | #324 | Tragic 79.4% |
| Hondurans | 0.0 /100 | #325 | Tragic 79.3% |
| Yuman | 0.0 /100 | #326 | Tragic 79.2% |
| Central Americans | 0.0 /100 | #327 | Tragic 79.2% |
| Hispanics or Latinos | 0.0 /100 | #328 | Tragic 79.1% |
| Dominicans | 0.0 /100 | #329 | Tragic 79.1% |
| Immigrants | Cabo Verde | 0.0 /100 | #330 | Tragic 78.9% |
Demographics Similar to Cypriots by GED/Equivalency
In terms of ged/equivalency, the demographic groups most similar to Cypriots are Okinawan (88.9%, a difference of 0.020%), Immigrants from Iran (88.9%, a difference of 0.030%), Lithuanian (88.9%, a difference of 0.040%), Immigrants from Taiwan (88.8%, a difference of 0.050%), and Bulgarian (89.0%, a difference of 0.080%).
| Demographics | Rating | Rank | GED/Equivalency |
| Eastern Europeans | 99.9 /100 | #7 | Exceptional 89.1% |
| Carpatho Rusyns | 99.9 /100 | #8 | Exceptional 89.1% |
| Chinese | 99.9 /100 | #9 | Exceptional 89.0% |
| Norwegians | 99.9 /100 | #10 | Exceptional 89.0% |
| Bulgarians | 99.9 /100 | #11 | Exceptional 89.0% |
| Lithuanians | 99.9 /100 | #12 | Exceptional 88.9% |
| Immigrants | Iran | 99.9 /100 | #13 | Exceptional 88.9% |
| Cypriots | 99.9 /100 | #14 | Exceptional 88.9% |
| Okinawans | 99.9 /100 | #15 | Exceptional 88.9% |
| Immigrants | Taiwan | 99.9 /100 | #16 | Exceptional 88.8% |
| Croatians | 99.9 /100 | #17 | Exceptional 88.8% |
| Slovenes | 99.9 /100 | #18 | Exceptional 88.8% |
| Swedes | 99.9 /100 | #19 | Exceptional 88.8% |
| Maltese | 99.9 /100 | #20 | Exceptional 88.6% |
| Luxembourgers | 99.8 /100 | #21 | Exceptional 88.6% |