Liberian vs Cypriot Unemployment Among Ages 65 to 74 years
COMPARE
Liberian
Cypriot
Unemployment Among Ages 65 to 74 years
Unemployment Among Ages 65 to 74 years Comparison
Liberians
Cypriots
5.8%
UNEMPLOYMENT AMONG AGES 65 TO 74 YEARS
0.0/ 100
METRIC RATING
302nd/ 347
METRIC RANK
5.7%
UNEMPLOYMENT AMONG AGES 65 TO 74 YEARS
0.1/ 100
METRIC RATING
283rd/ 347
METRIC RANK
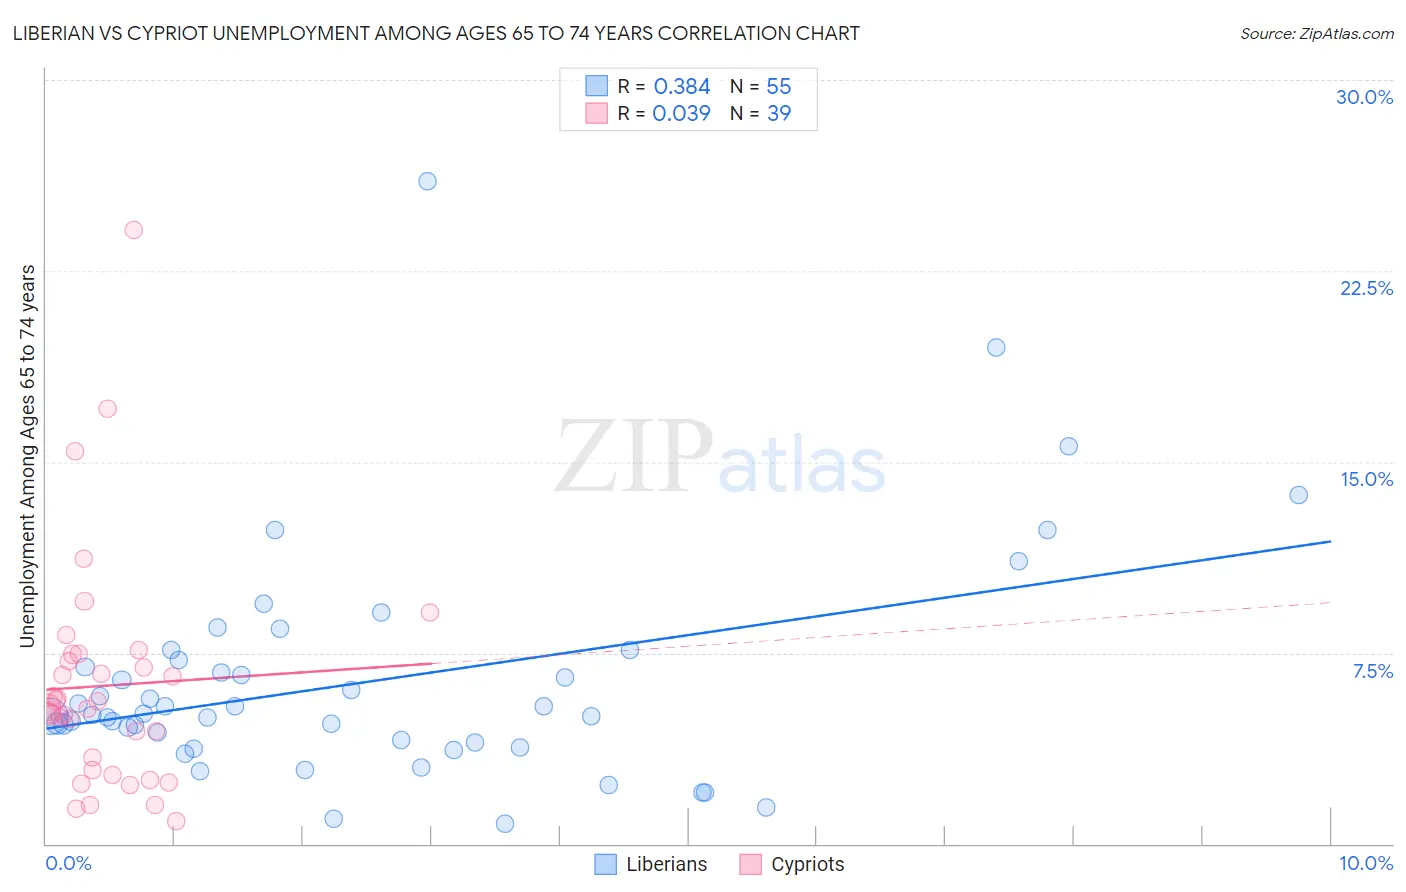
Liberian vs Cypriot Unemployment Among Ages 65 to 74 years Correlation Chart
The statistical analysis conducted on geographies consisting of 112,457,938 people shows a mild positive correlation between the proportion of Liberians and unemployment rate among population between the ages 65 and 74 in the United States with a correlation coefficient (R) of 0.384 and weighted average of 5.8%. Similarly, the statistical analysis conducted on geographies consisting of 60,122,993 people shows no correlation between the proportion of Cypriots and unemployment rate among population between the ages 65 and 74 in the United States with a correlation coefficient (R) of 0.039 and weighted average of 5.7%, a difference of 2.4%.
Unemployment Among Ages 65 to 74 years Correlation Summary
| Measurement | Liberian | Cypriot |
| Minimum | 0.80% | 0.90% |
| Maximum | 26.0% | 24.1% |
| Range | 25.2% | 23.2% |
| Mean | 6.4% | 6.2% |
| Median | 5.1% | 5.3% |
| Interquartile 25% (IQ1) | 4.0% | 2.9% |
| Interquartile 75% (IQ3) | 7.2% | 7.4% |
| Interquartile Range (IQR) | 3.2% | 4.5% |
| Standard Deviation (Sample) | 4.5% | 4.5% |
| Standard Deviation (Population) | 4.4% | 4.5% |
Demographics Similar to Liberians and Cypriots by Unemployment Among Ages 65 to 74 years
In terms of unemployment among ages 65 to 74 years, the demographic groups most similar to Liberians are Armenian (5.8%, a difference of 0.12%), Ecuadorian (5.8%, a difference of 0.23%), Barbadian (5.8%, a difference of 0.24%), Immigrants from Latin America (5.8%, a difference of 0.25%), and Houma (5.8%, a difference of 0.43%). Similarly, the demographic groups most similar to Cypriots are Chippewa (5.7%, a difference of 0.010%), Ottawa (5.7%, a difference of 0.030%), Immigrants from Sierra Leone (5.7%, a difference of 0.060%), Marshallese (5.7%, a difference of 0.090%), and Central American Indian (5.7%, a difference of 0.17%).
| Demographics | Rating | Rank | Unemployment Among Ages 65 to 74 years |
| Ottawa | 0.1 /100 | #282 | Tragic 5.7% |
| Cypriots | 0.1 /100 | #283 | Tragic 5.7% |
| Chippewa | 0.1 /100 | #284 | Tragic 5.7% |
| Immigrants | Sierra Leone | 0.1 /100 | #285 | Tragic 5.7% |
| Marshallese | 0.1 /100 | #286 | Tragic 5.7% |
| Central American Indians | 0.0 /100 | #287 | Tragic 5.7% |
| Central Americans | 0.0 /100 | #288 | Tragic 5.7% |
| Immigrants | Somalia | 0.0 /100 | #289 | Tragic 5.7% |
| Spanish American Indians | 0.0 /100 | #290 | Tragic 5.7% |
| Portuguese | 0.0 /100 | #291 | Tragic 5.7% |
| U.S. Virgin Islanders | 0.0 /100 | #292 | Tragic 5.8% |
| Immigrants | Grenada | 0.0 /100 | #293 | Tragic 5.8% |
| Immigrants | Morocco | 0.0 /100 | #294 | Tragic 5.8% |
| Blacks/African Americans | 0.0 /100 | #295 | Tragic 5.8% |
| Pennsylvania Germans | 0.0 /100 | #296 | Tragic 5.8% |
| Houma | 0.0 /100 | #297 | Tragic 5.8% |
| Immigrants | Latin America | 0.0 /100 | #298 | Tragic 5.8% |
| Barbadians | 0.0 /100 | #299 | Tragic 5.8% |
| Ecuadorians | 0.0 /100 | #300 | Tragic 5.8% |
| Armenians | 0.0 /100 | #301 | Tragic 5.8% |
| Liberians | 0.0 /100 | #302 | Tragic 5.8% |