Lebanese vs Yup'ik College, 1 year or more
COMPARE
Lebanese
Yup'ik
College, 1 year or more
College, 1 year or more Comparison
Lebanese
Yup'ik
61.6%
COLLEGE, 1 YEAR OR MORE
94.1/ 100
METRIC RATING
116th/ 347
METRIC RANK
39.4%
COLLEGE, 1 YEAR OR MORE
0.0/ 100
METRIC RATING
347th/ 347
METRIC RANK
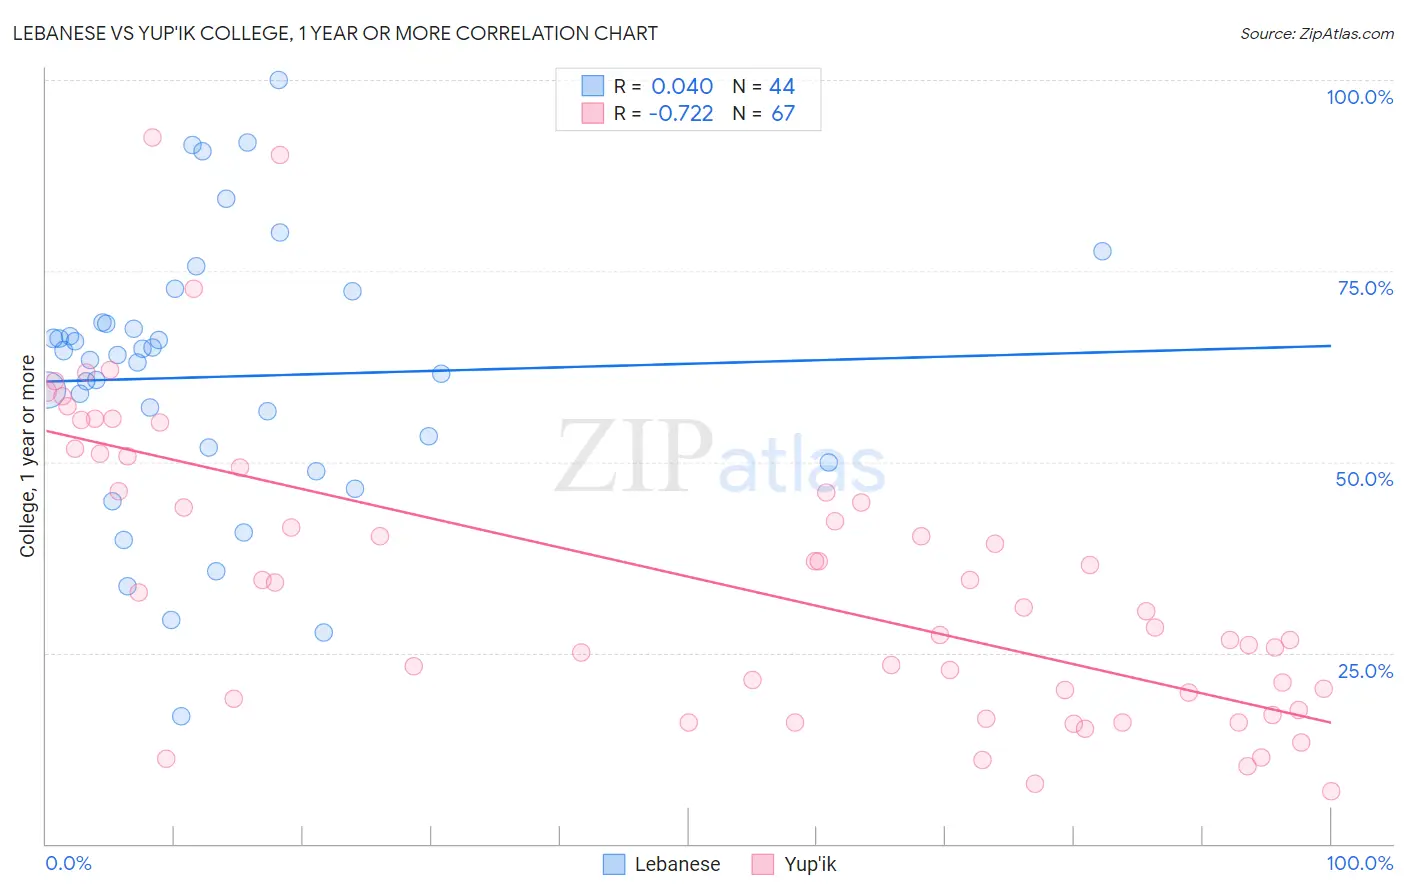
Lebanese vs Yup'ik College, 1 year or more Correlation Chart
The statistical analysis conducted on geographies consisting of 401,622,274 people shows no correlation between the proportion of Lebanese and percentage of population with at least college, 1 year or more education in the United States with a correlation coefficient (R) of 0.040 and weighted average of 61.6%. Similarly, the statistical analysis conducted on geographies consisting of 39,964,300 people shows a strong negative correlation between the proportion of Yup'ik and percentage of population with at least college, 1 year or more education in the United States with a correlation coefficient (R) of -0.722 and weighted average of 39.4%, a difference of 56.2%.
College, 1 year or more Correlation Summary
| Measurement | Lebanese | Yup'ik |
| Minimum | 16.6% | 6.9% |
| Maximum | 100.0% | 92.4% |
| Range | 83.4% | 85.5% |
| Mean | 61.1% | 34.7% |
| Median | 63.7% | 30.9% |
| Interquartile 25% (IQ1) | 50.9% | 19.0% |
| Interquartile 75% (IQ3) | 68.2% | 49.2% |
| Interquartile Range (IQR) | 17.3% | 30.2% |
| Standard Deviation (Sample) | 17.8% | 19.3% |
| Standard Deviation (Population) | 17.6% | 19.2% |
Similar Demographics by College, 1 year or more
Demographics Similar to Lebanese by College, 1 year or more
In terms of college, 1 year or more, the demographic groups most similar to Lebanese are Arab (61.6%, a difference of 0.040%), Immigrants from Brazil (61.6%, a difference of 0.050%), Norwegian (61.7%, a difference of 0.10%), Danish (61.7%, a difference of 0.17%), and Assyrian/Chaldean/Syriac (61.5%, a difference of 0.18%).
| Demographics | Rating | Rank | College, 1 year or more |
| Immigrants | Northern Africa | 95.7 /100 | #109 | Exceptional 61.9% |
| Europeans | 95.6 /100 | #110 | Exceptional 61.8% |
| Macedonians | 95.6 /100 | #111 | Exceptional 61.8% |
| Austrians | 95.4 /100 | #112 | Exceptional 61.8% |
| Ukrainians | 95.2 /100 | #113 | Exceptional 61.8% |
| Danes | 94.8 /100 | #114 | Exceptional 61.7% |
| Norwegians | 94.5 /100 | #115 | Exceptional 61.7% |
| Lebanese | 94.1 /100 | #116 | Exceptional 61.6% |
| Arabs | 93.9 /100 | #117 | Exceptional 61.6% |
| Immigrants | Brazil | 93.9 /100 | #118 | Exceptional 61.6% |
| Assyrians/Chaldeans/Syriacs | 93.3 /100 | #119 | Exceptional 61.5% |
| Pakistanis | 93.2 /100 | #120 | Exceptional 61.5% |
| Immigrants | Jordan | 92.7 /100 | #121 | Exceptional 61.4% |
| Immigrants | Chile | 92.3 /100 | #122 | Exceptional 61.4% |
| Serbians | 92.2 /100 | #123 | Exceptional 61.4% |
Demographics Similar to Yup'ik by College, 1 year or more
In terms of college, 1 year or more, the demographic groups most similar to Yup'ik are Houma (41.2%, a difference of 4.5%), Pima (45.6%, a difference of 15.7%), Yakama (46.2%, a difference of 17.2%), Tohono O'odham (47.1%, a difference of 19.5%), and Inupiat (47.2%, a difference of 19.8%).
| Demographics | Rating | Rank | College, 1 year or more |
| Immigrants | Dominican Republic | 0.0 /100 | #333 | Tragic 49.1% |
| Lumbee | 0.0 /100 | #334 | Tragic 48.9% |
| Yuman | 0.0 /100 | #335 | Tragic 48.7% |
| Spanish American Indians | 0.0 /100 | #336 | Tragic 48.5% |
| Pennsylvania Germans | 0.0 /100 | #337 | Tragic 48.5% |
| Immigrants | Central America | 0.0 /100 | #338 | Tragic 48.5% |
| Immigrants | Azores | 0.0 /100 | #339 | Tragic 48.4% |
| Immigrants | Cabo Verde | 0.0 /100 | #340 | Tragic 48.1% |
| Immigrants | Mexico | 0.0 /100 | #341 | Tragic 47.5% |
| Inupiat | 0.0 /100 | #342 | Tragic 47.2% |
| Tohono O'odham | 0.0 /100 | #343 | Tragic 47.1% |
| Yakama | 0.0 /100 | #344 | Tragic 46.2% |
| Pima | 0.0 /100 | #345 | Tragic 45.6% |
| Houma | 0.0 /100 | #346 | Tragic 41.2% |
| Yup'ik | 0.0 /100 | #347 | Tragic 39.4% |