Lebanese vs Immigrants from Western Europe College, 1 year or more
COMPARE
Lebanese
Immigrants from Western Europe
College, 1 year or more
College, 1 year or more Comparison
Lebanese
Immigrants from Western Europe
61.6%
COLLEGE, 1 YEAR OR MORE
94.1/ 100
METRIC RATING
116th/ 347
METRIC RANK
62.7%
COLLEGE, 1 YEAR OR MORE
98.6/ 100
METRIC RATING
86th/ 347
METRIC RANK
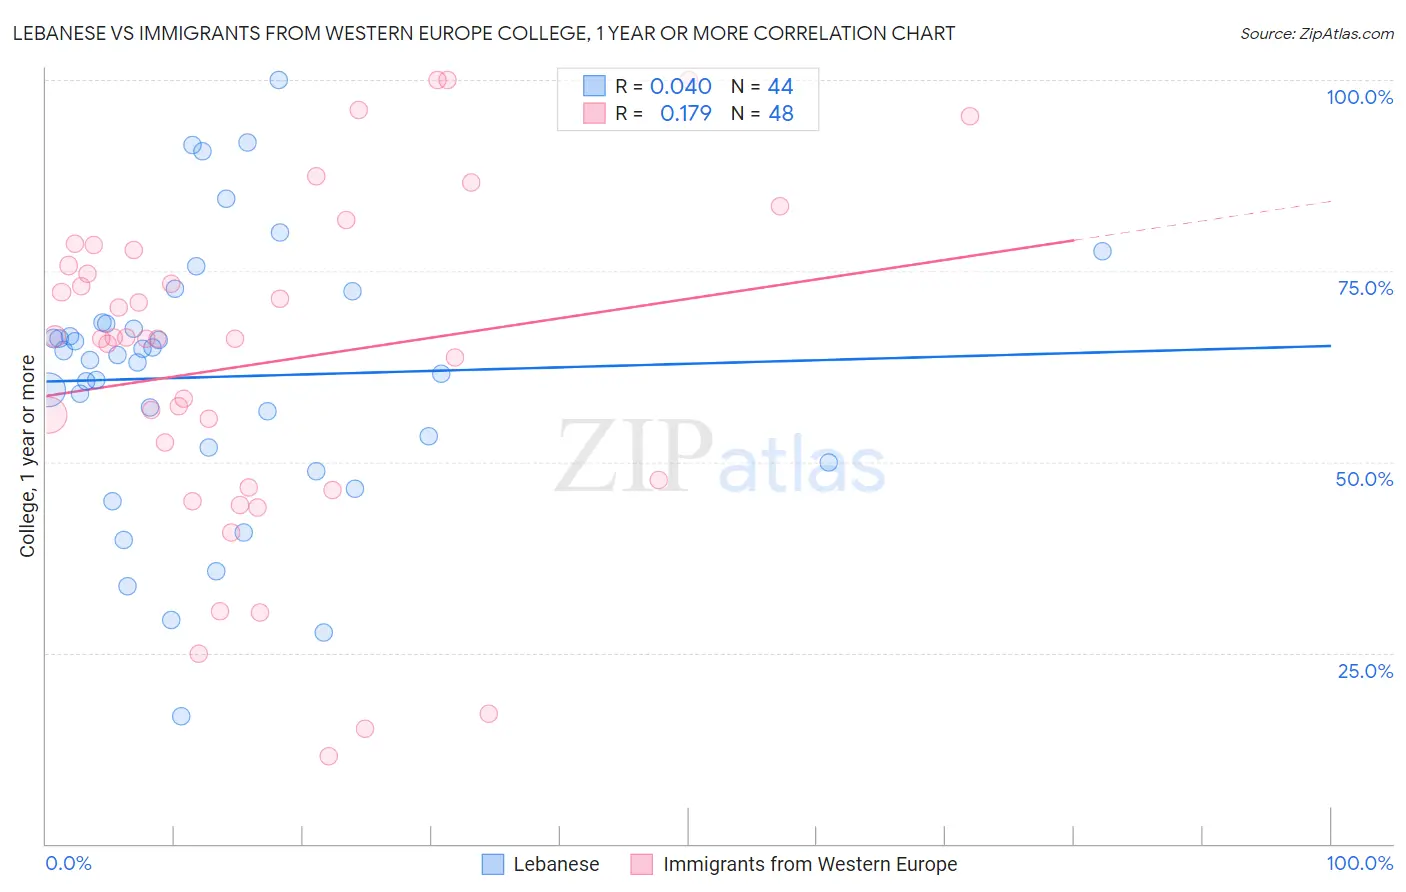
Lebanese vs Immigrants from Western Europe College, 1 year or more Correlation Chart
The statistical analysis conducted on geographies consisting of 401,622,274 people shows no correlation between the proportion of Lebanese and percentage of population with at least college, 1 year or more education in the United States with a correlation coefficient (R) of 0.040 and weighted average of 61.6%. Similarly, the statistical analysis conducted on geographies consisting of 494,075,353 people shows a poor positive correlation between the proportion of Immigrants from Western Europe and percentage of population with at least college, 1 year or more education in the United States with a correlation coefficient (R) of 0.179 and weighted average of 62.7%, a difference of 1.9%.
College, 1 year or more Correlation Summary
| Measurement | Lebanese | Immigrants from Western Europe |
| Minimum | 16.6% | 11.4% |
| Maximum | 100.0% | 100.0% |
| Range | 83.4% | 88.6% |
| Mean | 61.1% | 62.9% |
| Median | 63.7% | 66.2% |
| Interquartile 25% (IQ1) | 50.9% | 47.2% |
| Interquartile 75% (IQ3) | 68.2% | 76.8% |
| Interquartile Range (IQR) | 17.3% | 29.6% |
| Standard Deviation (Sample) | 17.8% | 22.1% |
| Standard Deviation (Population) | 17.6% | 21.9% |
Similar Demographics by College, 1 year or more
Demographics Similar to Lebanese by College, 1 year or more
In terms of college, 1 year or more, the demographic groups most similar to Lebanese are Arab (61.6%, a difference of 0.040%), Immigrants from Brazil (61.6%, a difference of 0.050%), Norwegian (61.7%, a difference of 0.10%), Danish (61.7%, a difference of 0.17%), and Assyrian/Chaldean/Syriac (61.5%, a difference of 0.18%).
| Demographics | Rating | Rank | College, 1 year or more |
| Immigrants | Northern Africa | 95.7 /100 | #109 | Exceptional 61.9% |
| Europeans | 95.6 /100 | #110 | Exceptional 61.8% |
| Macedonians | 95.6 /100 | #111 | Exceptional 61.8% |
| Austrians | 95.4 /100 | #112 | Exceptional 61.8% |
| Ukrainians | 95.2 /100 | #113 | Exceptional 61.8% |
| Danes | 94.8 /100 | #114 | Exceptional 61.7% |
| Norwegians | 94.5 /100 | #115 | Exceptional 61.7% |
| Lebanese | 94.1 /100 | #116 | Exceptional 61.6% |
| Arabs | 93.9 /100 | #117 | Exceptional 61.6% |
| Immigrants | Brazil | 93.9 /100 | #118 | Exceptional 61.6% |
| Assyrians/Chaldeans/Syriacs | 93.3 /100 | #119 | Exceptional 61.5% |
| Pakistanis | 93.2 /100 | #120 | Exceptional 61.5% |
| Immigrants | Jordan | 92.7 /100 | #121 | Exceptional 61.4% |
| Immigrants | Chile | 92.3 /100 | #122 | Exceptional 61.4% |
| Serbians | 92.2 /100 | #123 | Exceptional 61.4% |
Demographics Similar to Immigrants from Western Europe by College, 1 year or more
In terms of college, 1 year or more, the demographic groups most similar to Immigrants from Western Europe are Immigrants from Pakistan (62.8%, a difference of 0.020%), Immigrants from Hungary (62.7%, a difference of 0.020%), Immigrants from England (62.8%, a difference of 0.030%), Immigrants from Argentina (62.8%, a difference of 0.060%), and Immigrants from Bolivia (62.8%, a difference of 0.10%).
| Demographics | Rating | Rank | College, 1 year or more |
| Northern Europeans | 98.8 /100 | #79 | Exceptional 62.9% |
| Lithuanians | 98.8 /100 | #80 | Exceptional 62.9% |
| Laotians | 98.7 /100 | #81 | Exceptional 62.8% |
| Immigrants | Bolivia | 98.7 /100 | #82 | Exceptional 62.8% |
| Immigrants | Argentina | 98.6 /100 | #83 | Exceptional 62.8% |
| Immigrants | England | 98.6 /100 | #84 | Exceptional 62.8% |
| Immigrants | Pakistan | 98.6 /100 | #85 | Exceptional 62.8% |
| Immigrants | Western Europe | 98.6 /100 | #86 | Exceptional 62.7% |
| Immigrants | Hungary | 98.6 /100 | #87 | Exceptional 62.7% |
| Greeks | 98.3 /100 | #88 | Exceptional 62.6% |
| Immigrants | Ethiopia | 98.2 /100 | #89 | Exceptional 62.6% |
| Immigrants | Western Asia | 97.9 /100 | #90 | Exceptional 62.5% |
| Immigrants | Eastern Europe | 97.8 /100 | #91 | Exceptional 62.4% |
| Immigrants | Egypt | 97.8 /100 | #92 | Exceptional 62.4% |
| Romanians | 97.7 /100 | #93 | Exceptional 62.4% |