Lebanese vs Croatian College, 1 year or more
COMPARE
Lebanese
Croatian
College, 1 year or more
College, 1 year or more Comparison
Lebanese
Croatians
61.6%
COLLEGE, 1 YEAR OR MORE
94.1/ 100
METRIC RATING
116th/ 347
METRIC RANK
62.2%
COLLEGE, 1 YEAR OR MORE
97.1/ 100
METRIC RATING
99th/ 347
METRIC RANK
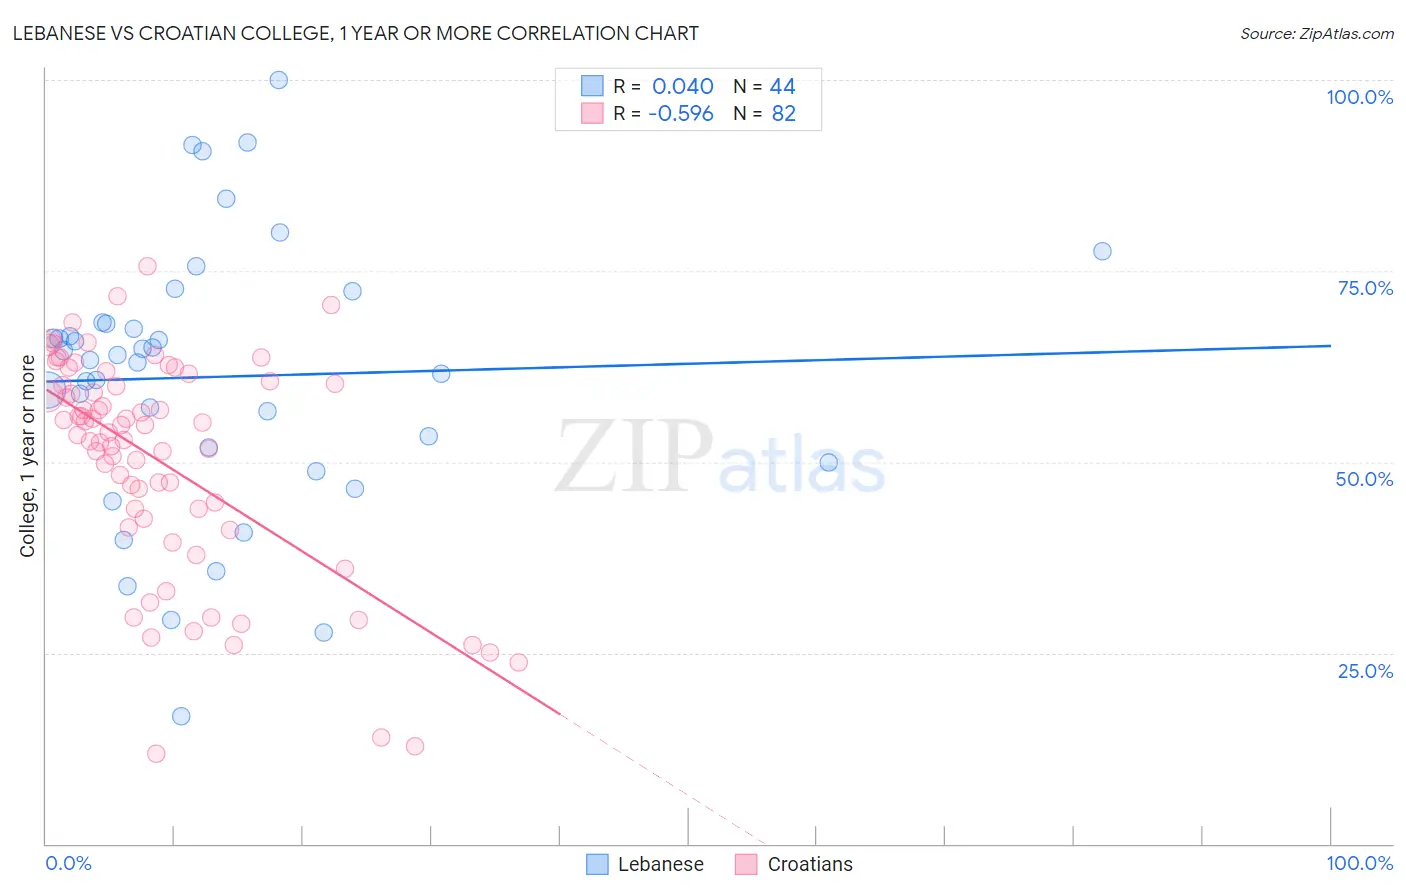
Lebanese vs Croatian College, 1 year or more Correlation Chart
The statistical analysis conducted on geographies consisting of 401,622,274 people shows no correlation between the proportion of Lebanese and percentage of population with at least college, 1 year or more education in the United States with a correlation coefficient (R) of 0.040 and weighted average of 61.6%. Similarly, the statistical analysis conducted on geographies consisting of 375,729,085 people shows a substantial negative correlation between the proportion of Croatians and percentage of population with at least college, 1 year or more education in the United States with a correlation coefficient (R) of -0.596 and weighted average of 62.2%, a difference of 0.97%.
College, 1 year or more Correlation Summary
| Measurement | Lebanese | Croatian |
| Minimum | 16.6% | 11.7% |
| Maximum | 100.0% | 75.6% |
| Range | 83.4% | 63.8% |
| Mean | 61.1% | 50.1% |
| Median | 63.7% | 54.4% |
| Interquartile 25% (IQ1) | 50.9% | 42.5% |
| Interquartile 75% (IQ3) | 68.2% | 60.2% |
| Interquartile Range (IQR) | 17.3% | 17.6% |
| Standard Deviation (Sample) | 17.8% | 14.4% |
| Standard Deviation (Population) | 17.6% | 14.3% |
Demographics Similar to Lebanese and Croatians by College, 1 year or more
In terms of college, 1 year or more, the demographic groups most similar to Lebanese are Arab (61.6%, a difference of 0.040%), Norwegian (61.7%, a difference of 0.10%), Danish (61.7%, a difference of 0.17%), Ukrainian (61.8%, a difference of 0.28%), and Austrian (61.8%, a difference of 0.35%). Similarly, the demographic groups most similar to Croatians are Carpatho Rusyn (62.2%, a difference of 0.0%), Jordanian (62.2%, a difference of 0.010%), Icelander (62.1%, a difference of 0.16%), Swedish (62.1%, a difference of 0.17%), and Luxembourger (62.1%, a difference of 0.18%).
| Demographics | Rating | Rank | College, 1 year or more |
| Jordanians | 97.2 /100 | #97 | Exceptional 62.2% |
| Carpatho Rusyns | 97.2 /100 | #98 | Exceptional 62.2% |
| Croatians | 97.1 /100 | #99 | Exceptional 62.2% |
| Icelanders | 96.8 /100 | #100 | Exceptional 62.1% |
| Swedes | 96.8 /100 | #101 | Exceptional 62.1% |
| Luxembourgers | 96.7 /100 | #102 | Exceptional 62.1% |
| Afghans | 96.4 /100 | #103 | Exceptional 62.0% |
| Chileans | 96.4 /100 | #104 | Exceptional 62.0% |
| Immigrants | Nepal | 96.3 /100 | #105 | Exceptional 62.0% |
| Palestinians | 96.3 /100 | #106 | Exceptional 62.0% |
| Immigrants | Ukraine | 95.8 /100 | #107 | Exceptional 61.9% |
| Syrians | 95.7 /100 | #108 | Exceptional 61.9% |
| Immigrants | Northern Africa | 95.7 /100 | #109 | Exceptional 61.9% |
| Europeans | 95.6 /100 | #110 | Exceptional 61.8% |
| Macedonians | 95.6 /100 | #111 | Exceptional 61.8% |
| Austrians | 95.4 /100 | #112 | Exceptional 61.8% |
| Ukrainians | 95.2 /100 | #113 | Exceptional 61.8% |
| Danes | 94.8 /100 | #114 | Exceptional 61.7% |
| Norwegians | 94.5 /100 | #115 | Exceptional 61.7% |
| Lebanese | 94.1 /100 | #116 | Exceptional 61.6% |
| Arabs | 93.9 /100 | #117 | Exceptional 61.6% |