Lebanese vs Indian (Asian) Unemployment Among Ages 45 to 54 years
COMPARE
Lebanese
Indian (Asian)
Unemployment Among Ages 45 to 54 years
Unemployment Among Ages 45 to 54 years Comparison
Lebanese
Indians (Asian)
4.4%
UNEMPLOYMENT AMONG AGES 45 TO 54 YEARS
81.9/ 100
METRIC RATING
137th/ 347
METRIC RANK
4.5%
UNEMPLOYMENT AMONG AGES 45 TO 54 YEARS
68.1/ 100
METRIC RATING
157th/ 347
METRIC RANK
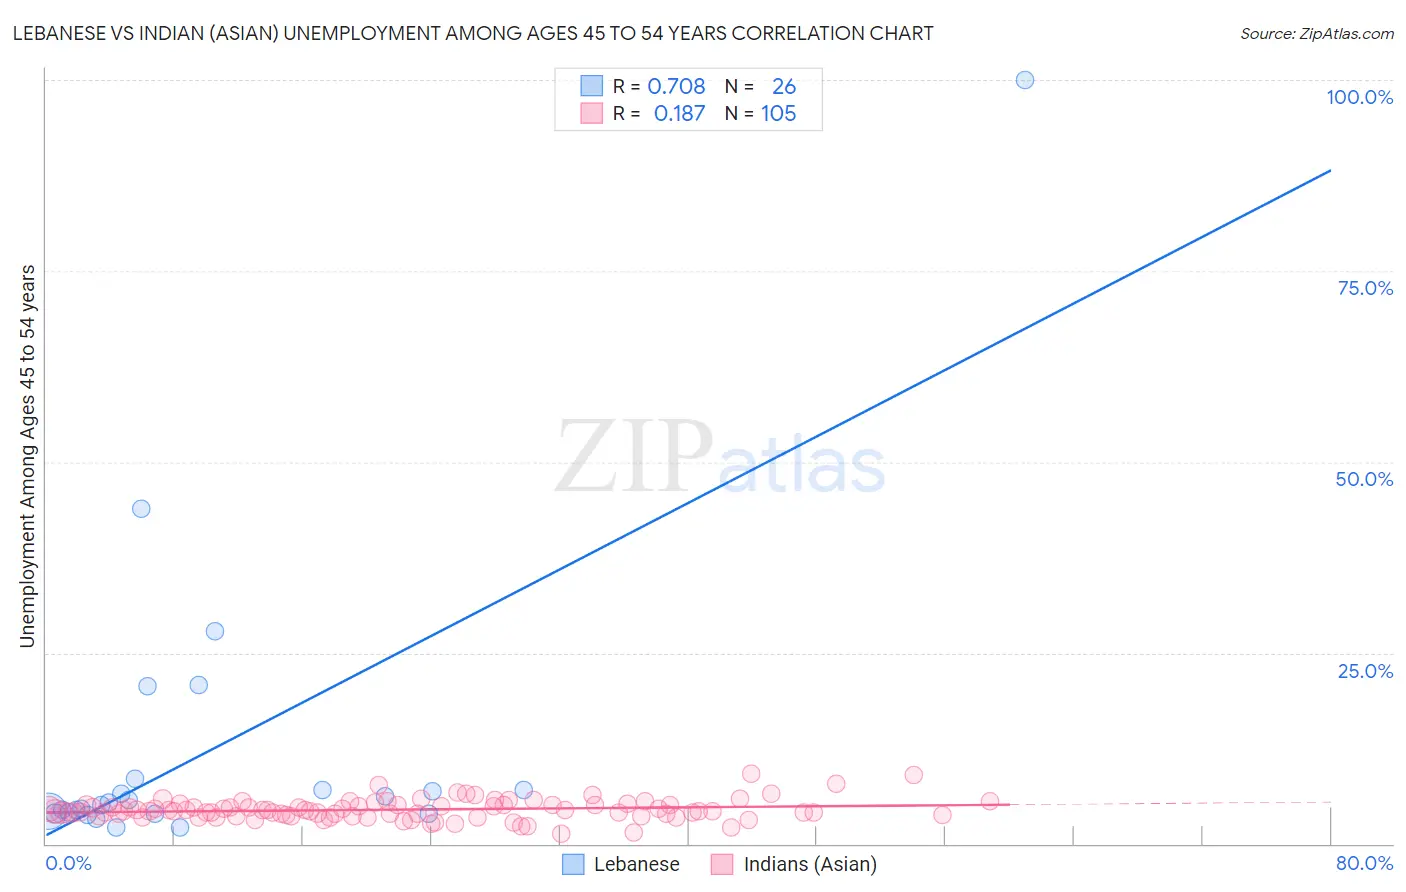
Lebanese vs Indian (Asian) Unemployment Among Ages 45 to 54 years Correlation Chart
The statistical analysis conducted on geographies consisting of 390,458,993 people shows a strong positive correlation between the proportion of Lebanese and unemployment rate among population between the ages 45 and 54 in the United States with a correlation coefficient (R) of 0.708 and weighted average of 4.4%. Similarly, the statistical analysis conducted on geographies consisting of 475,616,910 people shows a poor positive correlation between the proportion of Indians (Asian) and unemployment rate among population between the ages 45 and 54 in the United States with a correlation coefficient (R) of 0.187 and weighted average of 4.5%, a difference of 0.90%.
Unemployment Among Ages 45 to 54 years Correlation Summary
| Measurement | Lebanese | Indian (Asian) |
| Minimum | 2.2% | 1.3% |
| Maximum | 100.0% | 9.1% |
| Range | 97.8% | 7.8% |
| Mean | 12.2% | 4.5% |
| Median | 5.2% | 4.3% |
| Interquartile 25% (IQ1) | 4.0% | 3.7% |
| Interquartile 75% (IQ3) | 7.0% | 5.1% |
| Interquartile Range (IQR) | 3.0% | 1.3% |
| Standard Deviation (Sample) | 20.3% | 1.3% |
| Standard Deviation (Population) | 19.9% | 1.3% |
Demographics Similar to Lebanese and Indians (Asian) by Unemployment Among Ages 45 to 54 years
In terms of unemployment among ages 45 to 54 years, the demographic groups most similar to Lebanese are Immigrants from Congo (4.4%, a difference of 0.010%), Immigrants from Kuwait (4.4%, a difference of 0.020%), Immigrants from Zaire (4.4%, a difference of 0.10%), Immigrants from Afghanistan (4.4%, a difference of 0.18%), and Immigrants from Netherlands (4.4%, a difference of 0.19%). Similarly, the demographic groups most similar to Indians (Asian) are Immigrants from Croatia (4.5%, a difference of 0.080%), Marshallese (4.5%, a difference of 0.14%), Immigrants from Spain (4.5%, a difference of 0.25%), Korean (4.5%, a difference of 0.28%), and Hungarian (4.5%, a difference of 0.28%).
| Demographics | Rating | Rank | Unemployment Among Ages 45 to 54 years |
| Lebanese | 81.9 /100 | #137 | Excellent 4.4% |
| Immigrants | Congo | 81.8 /100 | #138 | Excellent 4.4% |
| Immigrants | Kuwait | 81.7 /100 | #139 | Excellent 4.4% |
| Immigrants | Zaire | 80.7 /100 | #140 | Excellent 4.4% |
| Immigrants | Afghanistan | 79.6 /100 | #141 | Good 4.4% |
| Immigrants | Netherlands | 79.4 /100 | #142 | Good 4.4% |
| Macedonians | 79.0 /100 | #143 | Good 4.5% |
| Taiwanese | 77.9 /100 | #144 | Good 4.5% |
| Immigrants | Latvia | 77.5 /100 | #145 | Good 4.5% |
| Syrians | 77.3 /100 | #146 | Good 4.5% |
| Uruguayans | 76.9 /100 | #147 | Good 4.5% |
| Immigrants | Austria | 75.3 /100 | #148 | Good 4.5% |
| Costa Ricans | 75.3 /100 | #149 | Good 4.5% |
| Tsimshian | 74.6 /100 | #150 | Good 4.5% |
| Cypriots | 74.4 /100 | #151 | Good 4.5% |
| Koreans | 73.1 /100 | #152 | Good 4.5% |
| Hungarians | 73.0 /100 | #153 | Good 4.5% |
| Immigrants | Spain | 72.5 /100 | #154 | Good 4.5% |
| Marshallese | 70.6 /100 | #155 | Good 4.5% |
| Immigrants | Croatia | 69.6 /100 | #156 | Good 4.5% |
| Indians (Asian) | 68.1 /100 | #157 | Good 4.5% |