Lebanese vs Carpatho Rusyn No Schooling Completed
COMPARE
Lebanese
Carpatho Rusyn
No Schooling Completed
No Schooling Completed Comparison
Lebanese
Carpatho Rusyns
1.9%
NO SCHOOLING COMPLETED
96.0/ 100
METRIC RATING
116th/ 347
METRIC RANK
1.4%
NO SCHOOLING COMPLETED
100.0/ 100
METRIC RATING
6th/ 347
METRIC RANK
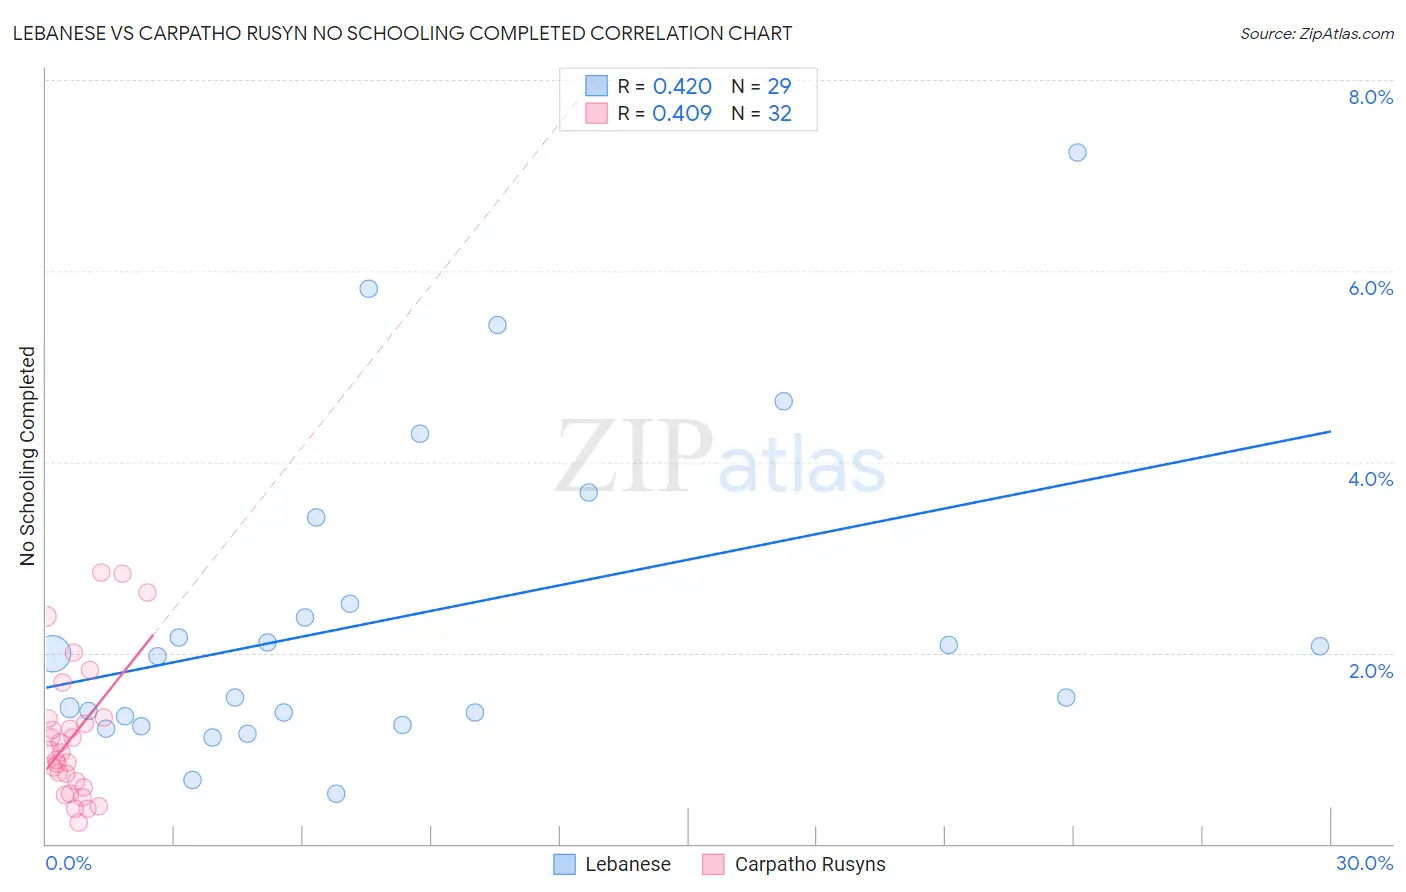
Lebanese vs Carpatho Rusyn No Schooling Completed Correlation Chart
The statistical analysis conducted on geographies consisting of 396,753,431 people shows a moderate positive correlation between the proportion of Lebanese and percentage of population with no schooling in the United States with a correlation coefficient (R) of 0.420 and weighted average of 1.9%. Similarly, the statistical analysis conducted on geographies consisting of 58,721,636 people shows a moderate positive correlation between the proportion of Carpatho Rusyns and percentage of population with no schooling in the United States with a correlation coefficient (R) of 0.409 and weighted average of 1.4%, a difference of 36.1%.
No Schooling Completed Correlation Summary
| Measurement | Lebanese | Carpatho Rusyn |
| Minimum | 0.52% | 0.23% |
| Maximum | 7.2% | 2.8% |
| Range | 6.7% | 2.6% |
| Mean | 2.4% | 1.1% |
| Median | 2.0% | 0.97% |
| Interquartile 25% (IQ1) | 1.3% | 0.62% |
| Interquartile 75% (IQ3) | 3.0% | 1.3% |
| Interquartile Range (IQR) | 1.7% | 0.70% |
| Standard Deviation (Sample) | 1.7% | 0.72% |
| Standard Deviation (Population) | 1.6% | 0.71% |
Similar Demographics by No Schooling Completed
Demographics Similar to Lebanese by No Schooling Completed
In terms of no schooling completed, the demographic groups most similar to Lebanese are Syrian (1.9%, a difference of 0.020%), Immigrants from Norway (1.9%, a difference of 0.15%), Immigrants from Zimbabwe (1.9%, a difference of 0.16%), Immigrants from Serbia (1.9%, a difference of 0.20%), and Pueblo (1.9%, a difference of 0.41%).
| Demographics | Rating | Rank | No Schooling Completed |
| Immigrants | Saudi Arabia | 96.8 /100 | #109 | Exceptional 1.9% |
| Immigrants | Latvia | 96.7 /100 | #110 | Exceptional 1.9% |
| Immigrants | Japan | 96.6 /100 | #111 | Exceptional 1.9% |
| Pueblo | 96.4 /100 | #112 | Exceptional 1.9% |
| Immigrants | Zimbabwe | 96.2 /100 | #113 | Exceptional 1.9% |
| Immigrants | Norway | 96.1 /100 | #114 | Exceptional 1.9% |
| Syrians | 96.0 /100 | #115 | Exceptional 1.9% |
| Lebanese | 96.0 /100 | #116 | Exceptional 1.9% |
| Immigrants | Serbia | 95.8 /100 | #117 | Exceptional 1.9% |
| Spanish | 95.5 /100 | #118 | Exceptional 1.9% |
| Iroquois | 95.1 /100 | #119 | Exceptional 1.9% |
| Immigrants | Bulgaria | 94.6 /100 | #120 | Exceptional 1.9% |
| Immigrants | Croatia | 94.5 /100 | #121 | Exceptional 1.9% |
| Cree | 94.5 /100 | #122 | Exceptional 1.9% |
| Immigrants | Kuwait | 93.9 /100 | #123 | Exceptional 1.9% |
Demographics Similar to Carpatho Rusyns by No Schooling Completed
In terms of no schooling completed, the demographic groups most similar to Carpatho Rusyns are Slovene (1.4%, a difference of 0.82%), English (1.4%, a difference of 0.97%), German (1.4%, a difference of 1.2%), Norwegian (1.3%, a difference of 1.8%), and Slovak (1.3%, a difference of 2.2%).
| Demographics | Rating | Rank | No Schooling Completed |
| Yup'ik | 100.0 /100 | #1 | Exceptional 1.2% |
| Slovaks | 100.0 /100 | #2 | Exceptional 1.3% |
| Norwegians | 100.0 /100 | #3 | Exceptional 1.3% |
| Germans | 100.0 /100 | #4 | Exceptional 1.4% |
| Slovenes | 100.0 /100 | #5 | Exceptional 1.4% |
| Carpatho Rusyns | 100.0 /100 | #6 | Exceptional 1.4% |
| English | 100.0 /100 | #7 | Exceptional 1.4% |
| Swedes | 100.0 /100 | #8 | Exceptional 1.4% |
| Scottish | 100.0 /100 | #9 | Exceptional 1.4% |
| Dutch | 100.0 /100 | #10 | Exceptional 1.4% |
| Lithuanians | 100.0 /100 | #11 | Exceptional 1.4% |
| Irish | 100.0 /100 | #12 | Exceptional 1.4% |
| Poles | 100.0 /100 | #13 | Exceptional 1.4% |
| Scotch-Irish | 100.0 /100 | #14 | Exceptional 1.5% |
| Tlingit-Haida | 100.0 /100 | #15 | Exceptional 1.5% |