Lebanese vs Potawatomi 10th Grade
COMPARE
Lebanese
Potawatomi
10th Grade
10th Grade Comparison
Lebanese
Potawatomi
94.6%
10TH GRADE
98.3/ 100
METRIC RATING
97th/ 347
METRIC RANK
94.3%
10TH GRADE
93.6/ 100
METRIC RATING
128th/ 347
METRIC RANK
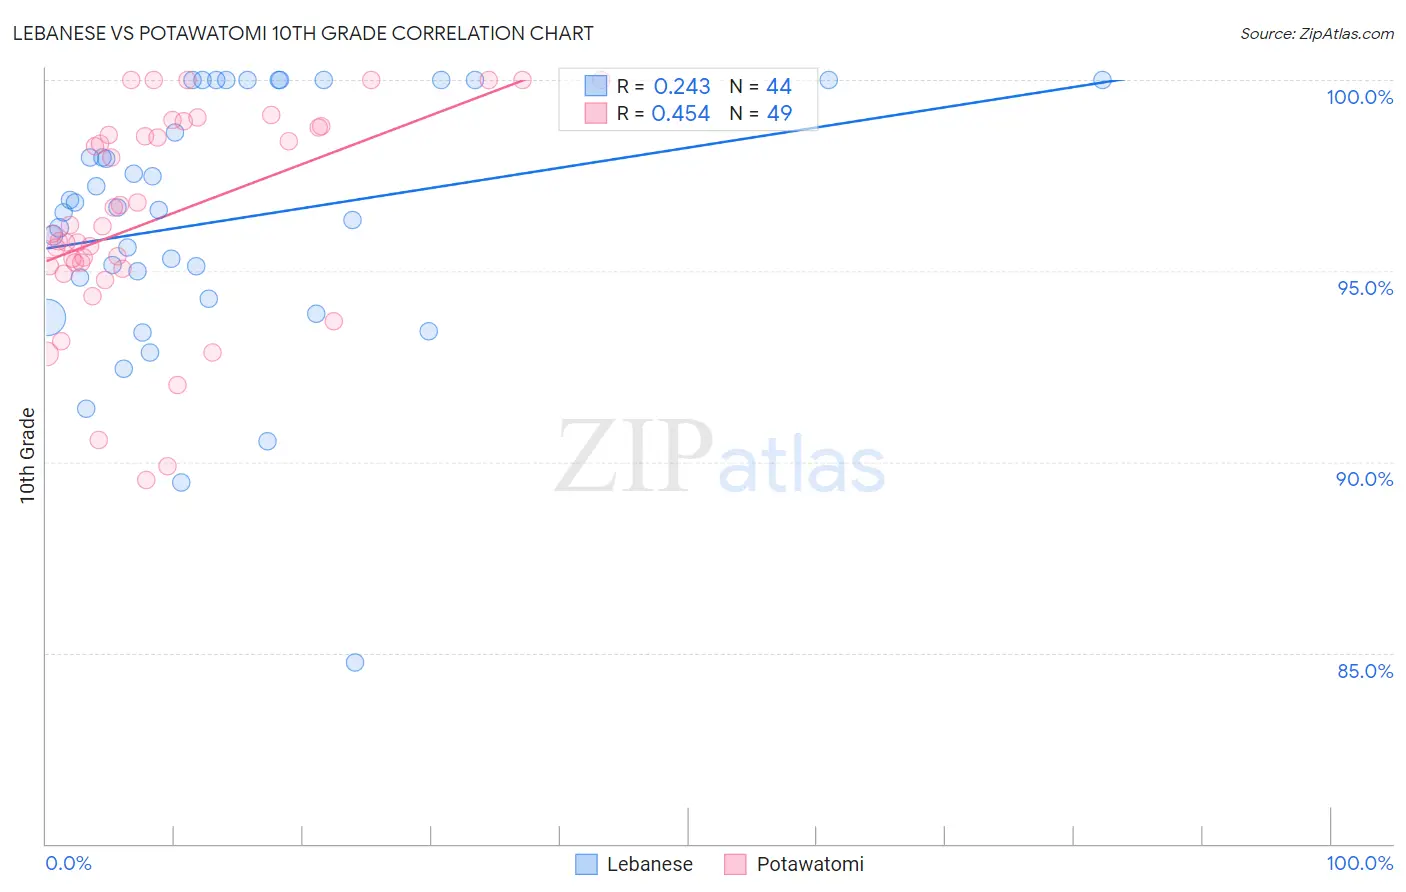
Lebanese vs Potawatomi 10th Grade Correlation Chart
The statistical analysis conducted on geographies consisting of 401,624,157 people shows a weak positive correlation between the proportion of Lebanese and percentage of population with at least 10th grade education in the United States with a correlation coefficient (R) of 0.243 and weighted average of 94.6%. Similarly, the statistical analysis conducted on geographies consisting of 117,769,158 people shows a moderate positive correlation between the proportion of Potawatomi and percentage of population with at least 10th grade education in the United States with a correlation coefficient (R) of 0.454 and weighted average of 94.3%, a difference of 0.30%.
10th Grade Correlation Summary
| Measurement | Lebanese | Potawatomi |
| Minimum | 84.7% | 89.5% |
| Maximum | 100.0% | 100.0% |
| Range | 15.3% | 10.5% |
| Mean | 96.3% | 96.4% |
| Median | 96.6% | 96.2% |
| Interquartile 25% (IQ1) | 94.5% | 95.1% |
| Interquartile 75% (IQ3) | 100.0% | 98.8% |
| Interquartile Range (IQR) | 5.5% | 3.7% |
| Standard Deviation (Sample) | 3.4% | 2.8% |
| Standard Deviation (Population) | 3.3% | 2.7% |
Similar Demographics by 10th Grade
Demographics Similar to Lebanese by 10th Grade
In terms of 10th grade, the demographic groups most similar to Lebanese are Menominee (94.6%, a difference of 0.0%), Immigrants from Switzerland (94.6%, a difference of 0.0%), Soviet Union (94.6%, a difference of 0.010%), Immigrants from Germany (94.6%, a difference of 0.010%), and Yugoslavian (94.6%, a difference of 0.020%).
| Demographics | Rating | Rank | 10th Grade |
| South Africans | 98.8 /100 | #90 | Exceptional 94.7% |
| Whites/Caucasians | 98.8 /100 | #91 | Exceptional 94.7% |
| Yugoslavians | 98.4 /100 | #92 | Exceptional 94.6% |
| Soviet Union | 98.3 /100 | #93 | Exceptional 94.6% |
| Immigrants | Germany | 98.3 /100 | #94 | Exceptional 94.6% |
| Menominee | 98.3 /100 | #95 | Exceptional 94.6% |
| Immigrants | Switzerland | 98.3 /100 | #96 | Exceptional 94.6% |
| Lebanese | 98.3 /100 | #97 | Exceptional 94.6% |
| Immigrants | Bulgaria | 98.1 /100 | #98 | Exceptional 94.6% |
| Immigrants | France | 97.9 /100 | #99 | Exceptional 94.5% |
| Immigrants | South Central Asia | 97.8 /100 | #100 | Exceptional 94.5% |
| Syrians | 97.7 /100 | #101 | Exceptional 94.5% |
| Cambodians | 97.6 /100 | #102 | Exceptional 94.5% |
| Immigrants | Europe | 97.5 /100 | #103 | Exceptional 94.5% |
| Immigrants | Romania | 97.5 /100 | #104 | Exceptional 94.5% |
Demographics Similar to Potawatomi by 10th Grade
In terms of 10th grade, the demographic groups most similar to Potawatomi are Israeli (94.3%, a difference of 0.010%), American (94.3%, a difference of 0.030%), Immigrants from Iran (94.3%, a difference of 0.030%), Iroquois (94.3%, a difference of 0.030%), and Immigrants from Greece (94.3%, a difference of 0.030%).
| Demographics | Rating | Rank | 10th Grade |
| Immigrants | Belarus | 95.2 /100 | #121 | Exceptional 94.4% |
| Inupiat | 95.1 /100 | #122 | Exceptional 94.4% |
| Cree | 95.1 /100 | #123 | Exceptional 94.4% |
| Basques | 94.9 /100 | #124 | Exceptional 94.3% |
| Americans | 94.4 /100 | #125 | Exceptional 94.3% |
| Immigrants | Iran | 94.4 /100 | #126 | Exceptional 94.3% |
| Israelis | 93.8 /100 | #127 | Exceptional 94.3% |
| Potawatomi | 93.6 /100 | #128 | Exceptional 94.3% |
| Iroquois | 92.8 /100 | #129 | Exceptional 94.3% |
| Immigrants | Greece | 92.7 /100 | #130 | Exceptional 94.3% |
| Immigrants | Eastern Europe | 92.5 /100 | #131 | Exceptional 94.3% |
| Immigrants | Russia | 92.4 /100 | #132 | Exceptional 94.3% |
| Creek | 91.9 /100 | #133 | Exceptional 94.2% |
| Osage | 91.7 /100 | #134 | Exceptional 94.2% |
| Immigrants | Korea | 91.3 /100 | #135 | Exceptional 94.2% |