Lebanese vs Immigrants from Afghanistan Master's Degree
COMPARE
Lebanese
Immigrants from Afghanistan
Master's Degree
Master's Degree Comparison
Lebanese
Immigrants from Afghanistan
16.5%
MASTER'S DEGREE
96.4/ 100
METRIC RATING
120th/ 347
METRIC RANK
15.6%
MASTER'S DEGREE
79.4/ 100
METRIC RATING
146th/ 347
METRIC RANK
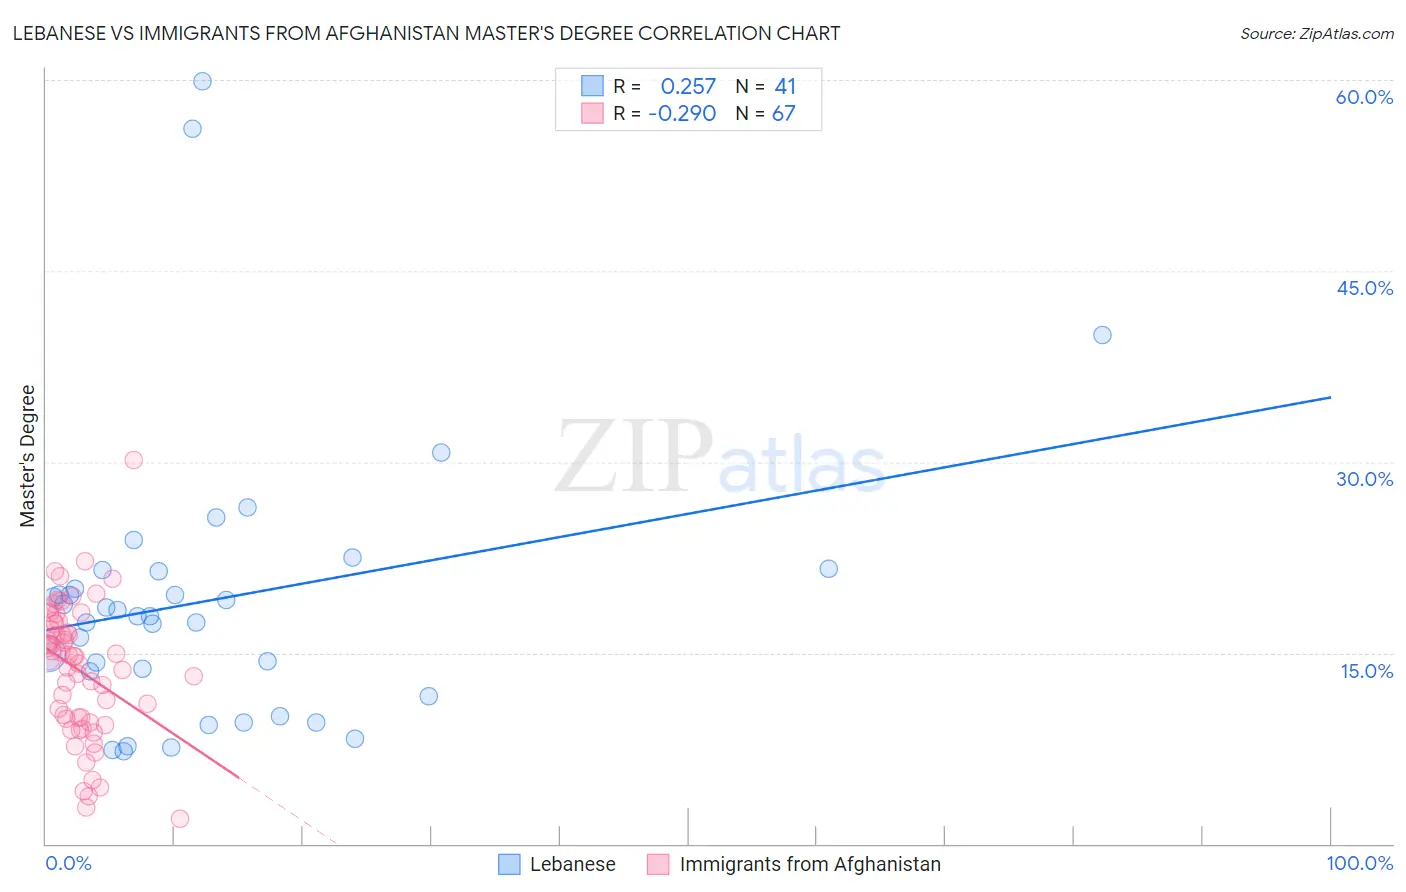
Lebanese vs Immigrants from Afghanistan Master's Degree Correlation Chart
The statistical analysis conducted on geographies consisting of 401,481,649 people shows a weak positive correlation between the proportion of Lebanese and percentage of population with at least master's degree education in the United States with a correlation coefficient (R) of 0.257 and weighted average of 16.5%. Similarly, the statistical analysis conducted on geographies consisting of 147,637,931 people shows a weak negative correlation between the proportion of Immigrants from Afghanistan and percentage of population with at least master's degree education in the United States with a correlation coefficient (R) of -0.290 and weighted average of 15.6%, a difference of 6.0%.
Master's Degree Correlation Summary
| Measurement | Lebanese | Immigrants from Afghanistan |
| Minimum | 7.3% | 2.0% |
| Maximum | 60.0% | 30.1% |
| Range | 52.6% | 28.1% |
| Mean | 19.2% | 13.6% |
| Median | 17.9% | 14.7% |
| Interquartile 25% (IQ1) | 12.6% | 9.9% |
| Interquartile 75% (IQ3) | 21.4% | 17.3% |
| Interquartile Range (IQR) | 8.9% | 7.4% |
| Standard Deviation (Sample) | 11.2% | 5.3% |
| Standard Deviation (Population) | 11.0% | 5.2% |
Similar Demographics by Master's Degree
Demographics Similar to Lebanese by Master's Degree
In terms of master's degree, the demographic groups most similar to Lebanese are Jordanian (16.5%, a difference of 0.10%), Afghan (16.5%, a difference of 0.20%), Brazilian (16.5%, a difference of 0.33%), British (16.4%, a difference of 0.63%), and Croatian (16.4%, a difference of 0.64%).
| Demographics | Rating | Rank | Master's Degree |
| Arabs | 97.7 /100 | #113 | Exceptional 16.7% |
| Northern Europeans | 97.6 /100 | #114 | Exceptional 16.7% |
| Immigrants | Uganda | 97.3 /100 | #115 | Exceptional 16.6% |
| Immigrants | Southern Europe | 97.2 /100 | #116 | Exceptional 16.6% |
| Immigrants | Moldova | 97.2 /100 | #117 | Exceptional 16.6% |
| Brazilians | 96.8 /100 | #118 | Exceptional 16.5% |
| Jordanians | 96.5 /100 | #119 | Exceptional 16.5% |
| Lebanese | 96.4 /100 | #120 | Exceptional 16.5% |
| Afghans | 96.2 /100 | #121 | Exceptional 16.5% |
| British | 95.6 /100 | #122 | Exceptional 16.4% |
| Croatians | 95.6 /100 | #123 | Exceptional 16.4% |
| Immigrants | Eritrea | 95.5 /100 | #124 | Exceptional 16.4% |
| Italians | 95.4 /100 | #125 | Exceptional 16.4% |
| Immigrants | Eastern Africa | 95.2 /100 | #126 | Exceptional 16.3% |
| Palestinians | 94.8 /100 | #127 | Exceptional 16.3% |
Demographics Similar to Immigrants from Afghanistan by Master's Degree
In terms of master's degree, the demographic groups most similar to Immigrants from Afghanistan are Hungarian (15.6%, a difference of 0.040%), Immigrants from Senegal (15.5%, a difference of 0.21%), Ghanaian (15.5%, a difference of 0.22%), Slovene (15.5%, a difference of 0.25%), and South American (15.6%, a difference of 0.37%).
| Demographics | Rating | Rank | Master's Degree |
| Immigrants | Germany | 85.9 /100 | #139 | Excellent 15.8% |
| Vietnamese | 85.5 /100 | #140 | Excellent 15.8% |
| Poles | 85.0 /100 | #141 | Excellent 15.7% |
| Immigrants | Africa | 84.0 /100 | #142 | Excellent 15.7% |
| Immigrants | Venezuela | 83.6 /100 | #143 | Excellent 15.7% |
| Canadians | 83.3 /100 | #144 | Excellent 15.7% |
| South Americans | 81.3 /100 | #145 | Excellent 15.6% |
| Immigrants | Afghanistan | 79.4 /100 | #146 | Good 15.6% |
| Hungarians | 79.1 /100 | #147 | Good 15.6% |
| Immigrants | Senegal | 78.2 /100 | #148 | Good 15.5% |
| Ghanaians | 78.2 /100 | #149 | Good 15.5% |
| Slovenes | 78.0 /100 | #150 | Good 15.5% |
| Iraqis | 77.3 /100 | #151 | Good 15.5% |
| Slavs | 77.0 /100 | #152 | Good 15.5% |
| Icelanders | 76.8 /100 | #153 | Good 15.5% |