Palestinian vs Immigrants from Kenya 9th Grade
COMPARE
Palestinian
Immigrants from Kenya
9th Grade
9th Grade Comparison
Palestinians
Immigrants from Kenya
95.4%
9TH GRADE
94.3/ 100
METRIC RATING
127th/ 347
METRIC RANK
95.0%
9TH GRADE
73.1/ 100
METRIC RATING
156th/ 347
METRIC RANK
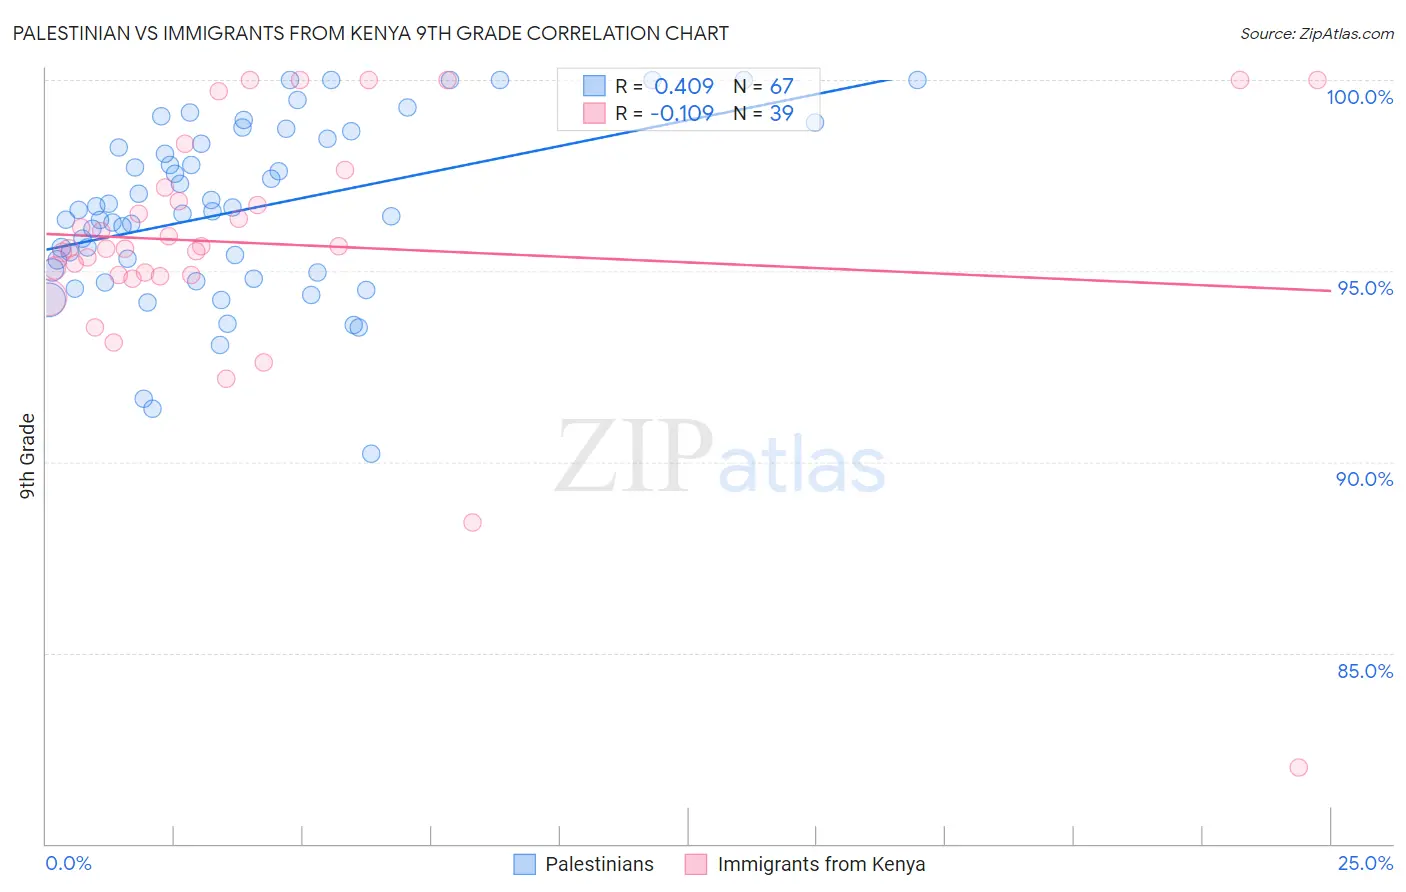
Palestinian vs Immigrants from Kenya 9th Grade Correlation Chart
The statistical analysis conducted on geographies consisting of 216,424,519 people shows a moderate positive correlation between the proportion of Palestinians and percentage of population with at least 9th grade education in the United States with a correlation coefficient (R) of 0.409 and weighted average of 95.4%. Similarly, the statistical analysis conducted on geographies consisting of 218,076,690 people shows a poor negative correlation between the proportion of Immigrants from Kenya and percentage of population with at least 9th grade education in the United States with a correlation coefficient (R) of -0.109 and weighted average of 95.0%, a difference of 0.33%.
9th Grade Correlation Summary
| Measurement | Palestinian | Immigrants from Kenya |
| Minimum | 90.2% | 82.0% |
| Maximum | 100.0% | 100.0% |
| Range | 9.8% | 18.0% |
| Mean | 96.6% | 95.7% |
| Median | 96.6% | 95.6% |
| Interquartile 25% (IQ1) | 94.9% | 94.9% |
| Interquartile 75% (IQ3) | 98.5% | 97.2% |
| Interquartile Range (IQR) | 3.5% | 2.3% |
| Standard Deviation (Sample) | 2.3% | 3.3% |
| Standard Deviation (Population) | 2.3% | 3.3% |
Similar Demographics by 9th Grade
Demographics Similar to Palestinians by 9th Grade
In terms of 9th grade, the demographic groups most similar to Palestinians are Immigrants from Serbia (95.4%, a difference of 0.0%), Immigrants from Hungary (95.4%, a difference of 0.0%), Basque (95.4%, a difference of 0.010%), Jordanian (95.3%, a difference of 0.020%), and Immigrants from South Central Asia (95.4%, a difference of 0.030%).
| Demographics | Rating | Rank | 9th Grade |
| Cambodians | 95.6 /100 | #120 | Exceptional 95.4% |
| Cree | 95.5 /100 | #121 | Exceptional 95.4% |
| Immigrants | Kuwait | 95.5 /100 | #122 | Exceptional 95.4% |
| Kiowa | 95.3 /100 | #123 | Exceptional 95.4% |
| Shoshone | 95.3 /100 | #124 | Exceptional 95.4% |
| Immigrants | South Central Asia | 95.1 /100 | #125 | Exceptional 95.4% |
| Immigrants | Serbia | 94.4 /100 | #126 | Exceptional 95.4% |
| Palestinians | 94.3 /100 | #127 | Exceptional 95.4% |
| Immigrants | Hungary | 94.2 /100 | #128 | Exceptional 95.4% |
| Basques | 94.1 /100 | #129 | Exceptional 95.4% |
| Jordanians | 93.5 /100 | #130 | Exceptional 95.3% |
| Immigrants | North Macedonia | 92.3 /100 | #131 | Exceptional 95.3% |
| Immigrants | Nonimmigrants | 92.0 /100 | #132 | Exceptional 95.3% |
| Israelis | 90.4 /100 | #133 | Exceptional 95.3% |
| Immigrants | Israel | 89.6 /100 | #134 | Excellent 95.3% |
Demographics Similar to Immigrants from Kenya by 9th Grade
In terms of 9th grade, the demographic groups most similar to Immigrants from Kenya are Mongolian (95.0%, a difference of 0.0%), Arab (95.1%, a difference of 0.020%), Immigrants from Kazakhstan (95.1%, a difference of 0.020%), Albanian (95.1%, a difference of 0.030%), and Egyptian (95.0%, a difference of 0.030%).
| Demographics | Rating | Rank | 9th Grade |
| Immigrants | Korea | 79.6 /100 | #149 | Good 95.1% |
| Kenyans | 79.1 /100 | #150 | Good 95.1% |
| Cajuns | 77.3 /100 | #151 | Good 95.1% |
| Ugandans | 77.0 /100 | #152 | Good 95.1% |
| Albanians | 76.1 /100 | #153 | Good 95.1% |
| Arabs | 74.9 /100 | #154 | Good 95.1% |
| Immigrants | Kazakhstan | 74.7 /100 | #155 | Good 95.1% |
| Immigrants | Kenya | 73.1 /100 | #156 | Good 95.0% |
| Mongolians | 73.0 /100 | #157 | Good 95.0% |
| Egyptians | 70.1 /100 | #158 | Good 95.0% |
| Immigrants | Ukraine | 67.4 /100 | #159 | Good 95.0% |
| Immigrants | Italy | 66.6 /100 | #160 | Good 95.0% |
| French American Indians | 66.5 /100 | #161 | Good 95.0% |
| Bermudans | 65.8 /100 | #162 | Good 95.0% |
| Pakistanis | 64.1 /100 | #163 | Good 95.0% |