Latvian vs Immigrants from Laos 9th Grade
COMPARE
Latvian
Immigrants from Laos
9th Grade
9th Grade Comparison
Latvians
Immigrants from Laos
96.4%
9TH GRADE
100.0/ 100
METRIC RATING
24th/ 347
METRIC RANK
93.2%
9TH GRADE
0.0/ 100
METRIC RATING
292nd/ 347
METRIC RANK
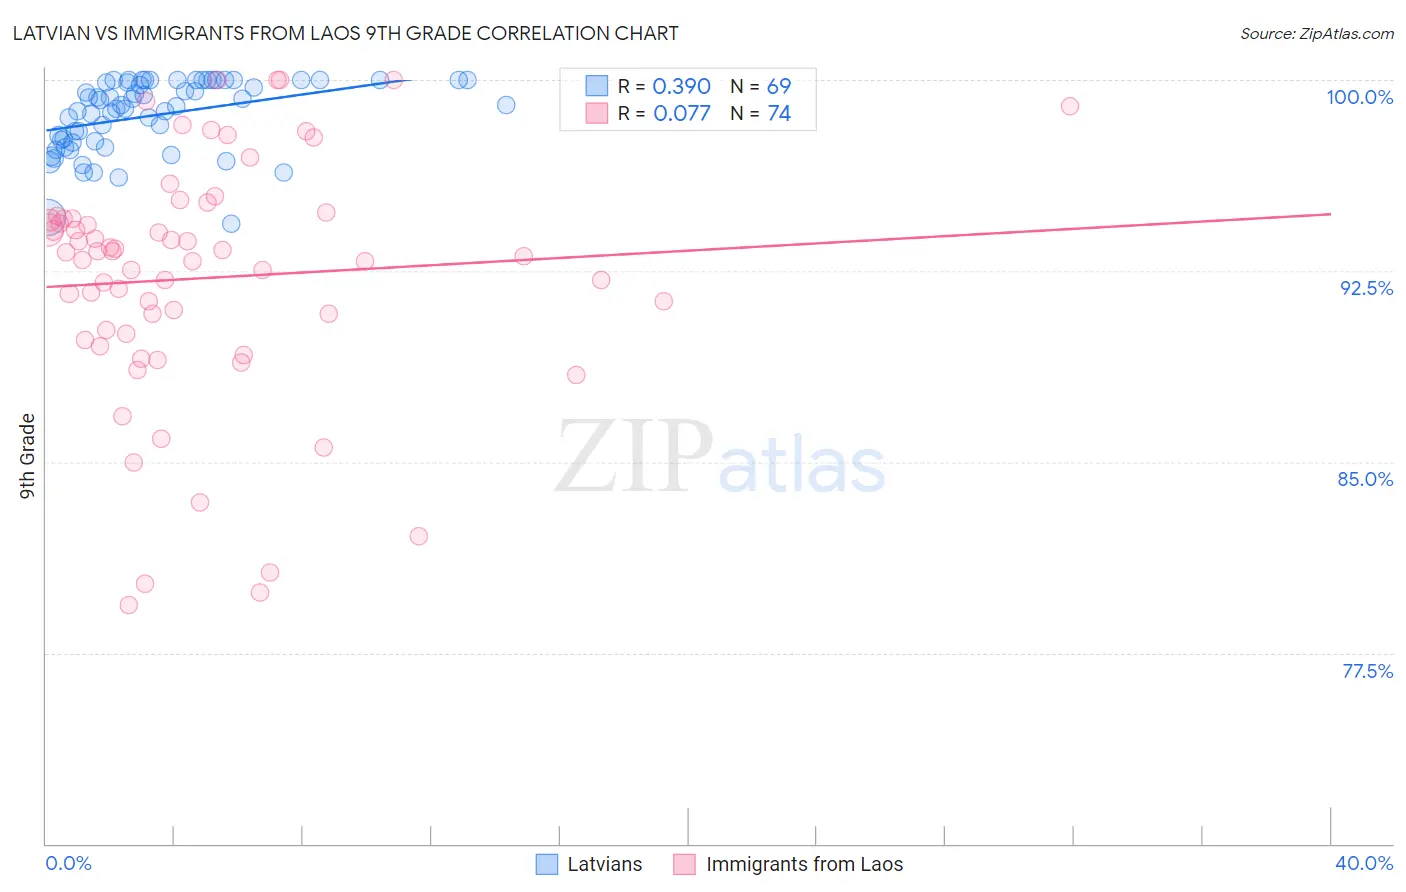
Latvian vs Immigrants from Laos 9th Grade Correlation Chart
The statistical analysis conducted on geographies consisting of 220,726,265 people shows a mild positive correlation between the proportion of Latvians and percentage of population with at least 9th grade education in the United States with a correlation coefficient (R) of 0.390 and weighted average of 96.4%. Similarly, the statistical analysis conducted on geographies consisting of 201,472,886 people shows a slight positive correlation between the proportion of Immigrants from Laos and percentage of population with at least 9th grade education in the United States with a correlation coefficient (R) of 0.077 and weighted average of 93.2%, a difference of 3.4%.
9th Grade Correlation Summary
| Measurement | Latvian | Immigrants from Laos |
| Minimum | 94.4% | 79.4% |
| Maximum | 100.0% | 100.0% |
| Range | 5.6% | 20.6% |
| Mean | 98.6% | 92.2% |
| Median | 99.0% | 93.1% |
| Interquartile 25% (IQ1) | 97.6% | 90.0% |
| Interquartile 75% (IQ3) | 100.0% | 94.6% |
| Interquartile Range (IQR) | 2.4% | 4.5% |
| Standard Deviation (Sample) | 1.4% | 4.8% |
| Standard Deviation (Population) | 1.4% | 4.8% |
Similar Demographics by 9th Grade
Demographics Similar to Latvians by 9th Grade
In terms of 9th grade, the demographic groups most similar to Latvians are French (96.3%, a difference of 0.010%), Czech (96.4%, a difference of 0.030%), European (96.4%, a difference of 0.040%), French Canadian (96.3%, a difference of 0.040%), and Alaskan Athabascan (96.4%, a difference of 0.050%).
| Demographics | Rating | Rank | 9th Grade |
| Dutch | 100.0 /100 | #17 | Exceptional 96.5% |
| Scandinavians | 100.0 /100 | #18 | Exceptional 96.5% |
| Welsh | 100.0 /100 | #19 | Exceptional 96.4% |
| Italians | 100.0 /100 | #20 | Exceptional 96.4% |
| Alaskan Athabascans | 100.0 /100 | #21 | Exceptional 96.4% |
| Europeans | 100.0 /100 | #22 | Exceptional 96.4% |
| Czechs | 100.0 /100 | #23 | Exceptional 96.4% |
| Latvians | 100.0 /100 | #24 | Exceptional 96.4% |
| French | 100.0 /100 | #25 | Exceptional 96.3% |
| French Canadians | 100.0 /100 | #26 | Exceptional 96.3% |
| Scotch-Irish | 100.0 /100 | #27 | Exceptional 96.3% |
| Eastern Europeans | 100.0 /100 | #28 | Exceptional 96.3% |
| Chinese | 100.0 /100 | #29 | Exceptional 96.3% |
| Maltese | 100.0 /100 | #30 | Exceptional 96.3% |
| British | 100.0 /100 | #31 | Exceptional 96.3% |
Demographics Similar to Immigrants from Laos by 9th Grade
In terms of 9th grade, the demographic groups most similar to Immigrants from Laos are Sri Lankan (93.2%, a difference of 0.010%), British West Indian (93.2%, a difference of 0.020%), Cuban (93.2%, a difference of 0.020%), Immigrants from Burma/Myanmar (93.1%, a difference of 0.040%), and Indonesian (93.1%, a difference of 0.040%).
| Demographics | Rating | Rank | 9th Grade |
| Immigrants | Peru | 0.0 /100 | #285 | Tragic 93.4% |
| Immigrants | Barbados | 0.0 /100 | #286 | Tragic 93.4% |
| Immigrants | St. Vincent and the Grenadines | 0.0 /100 | #287 | Tragic 93.4% |
| Immigrants | South Eastern Asia | 0.0 /100 | #288 | Tragic 93.3% |
| Immigrants | West Indies | 0.0 /100 | #289 | Tragic 93.3% |
| Pennsylvania Germans | 0.0 /100 | #290 | Tragic 93.3% |
| British West Indians | 0.0 /100 | #291 | Tragic 93.2% |
| Immigrants | Laos | 0.0 /100 | #292 | Tragic 93.2% |
| Sri Lankans | 0.0 /100 | #293 | Tragic 93.2% |
| Cubans | 0.0 /100 | #294 | Tragic 93.2% |
| Immigrants | Burma/Myanmar | 0.0 /100 | #295 | Tragic 93.1% |
| Indonesians | 0.0 /100 | #296 | Tragic 93.1% |
| Fijians | 0.0 /100 | #297 | Tragic 93.1% |
| Haitians | 0.0 /100 | #298 | Tragic 93.1% |
| Immigrants | Grenada | 0.0 /100 | #299 | Tragic 93.0% |