Latvian vs Alaska Native 9th Grade
COMPARE
Latvian
Alaska Native
9th Grade
9th Grade Comparison
Latvians
Alaska Natives
96.4%
9TH GRADE
100.0/ 100
METRIC RATING
24th/ 347
METRIC RANK
96.1%
9TH GRADE
99.9/ 100
METRIC RATING
44th/ 347
METRIC RANK
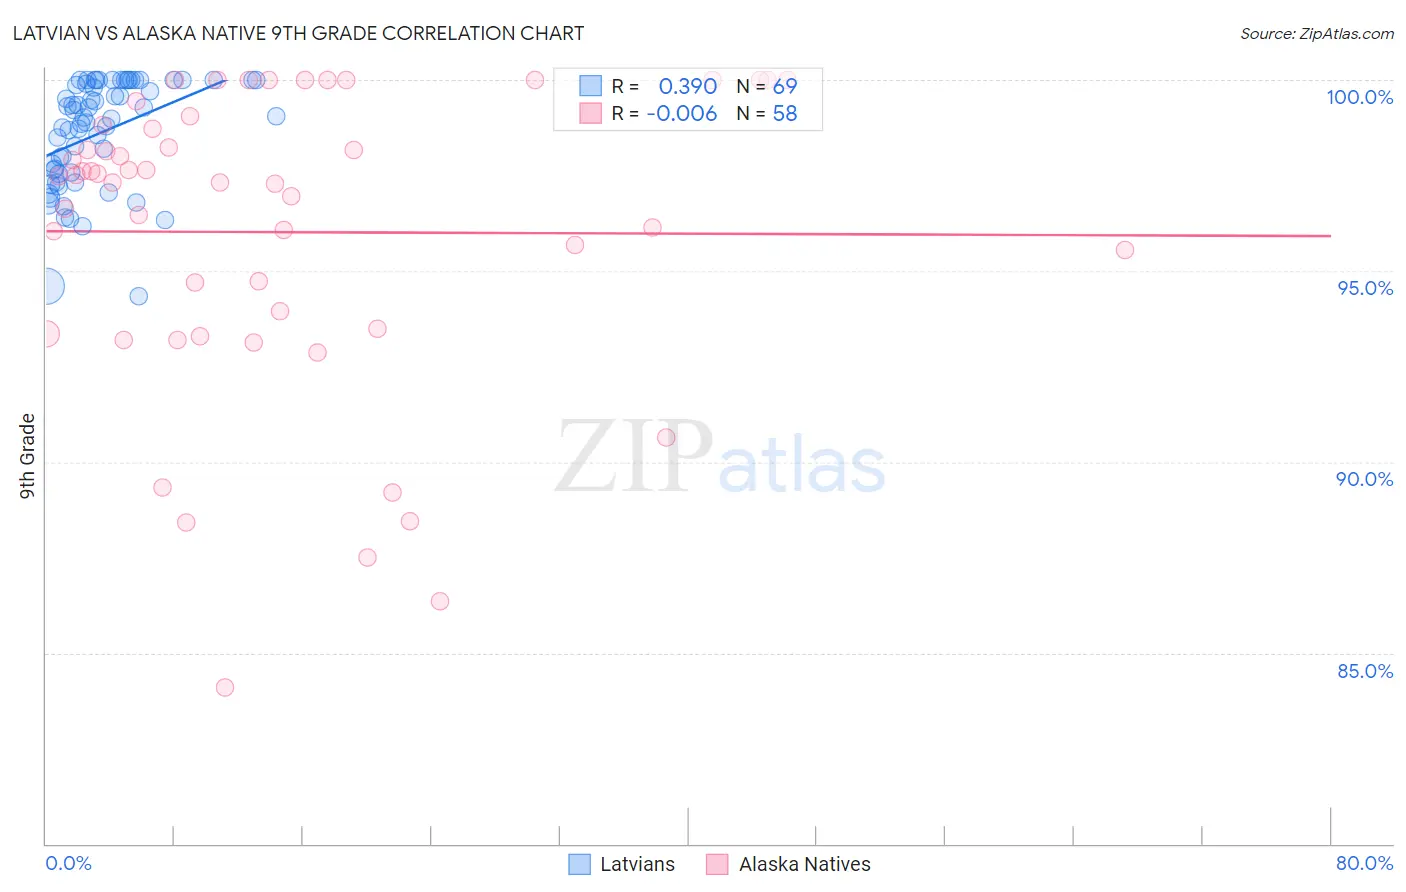
Latvian vs Alaska Native 9th Grade Correlation Chart
The statistical analysis conducted on geographies consisting of 220,726,265 people shows a mild positive correlation between the proportion of Latvians and percentage of population with at least 9th grade education in the United States with a correlation coefficient (R) of 0.390 and weighted average of 96.4%. Similarly, the statistical analysis conducted on geographies consisting of 76,778,057 people shows no correlation between the proportion of Alaska Natives and percentage of population with at least 9th grade education in the United States with a correlation coefficient (R) of -0.006 and weighted average of 96.1%, a difference of 0.29%.
9th Grade Correlation Summary
| Measurement | Latvian | Alaska Native |
| Minimum | 94.4% | 84.1% |
| Maximum | 100.0% | 100.0% |
| Range | 5.6% | 15.9% |
| Mean | 98.6% | 96.0% |
| Median | 99.0% | 97.4% |
| Interquartile 25% (IQ1) | 97.6% | 93.5% |
| Interquartile 75% (IQ3) | 100.0% | 98.8% |
| Interquartile Range (IQR) | 2.4% | 5.3% |
| Standard Deviation (Sample) | 1.4% | 3.9% |
| Standard Deviation (Population) | 1.4% | 3.9% |
Demographics Similar to Latvians and Alaska Natives by 9th Grade
In terms of 9th grade, the demographic groups most similar to Latvians are French (96.3%, a difference of 0.010%), French Canadian (96.3%, a difference of 0.040%), Scotch-Irish (96.3%, a difference of 0.050%), Eastern European (96.3%, a difference of 0.050%), and Chinese (96.3%, a difference of 0.060%). Similarly, the demographic groups most similar to Alaska Natives are Iranian (96.1%, a difference of 0.020%), Czechoslovakian (96.1%, a difference of 0.030%), Chippewa (96.1%, a difference of 0.030%), Slavic (96.1%, a difference of 0.040%), and Ottawa (96.1%, a difference of 0.060%).
| Demographics | Rating | Rank | 9th Grade |
| Latvians | 100.0 /100 | #24 | Exceptional 96.4% |
| French | 100.0 /100 | #25 | Exceptional 96.3% |
| French Canadians | 100.0 /100 | #26 | Exceptional 96.3% |
| Scotch-Irish | 100.0 /100 | #27 | Exceptional 96.3% |
| Eastern Europeans | 100.0 /100 | #28 | Exceptional 96.3% |
| Chinese | 100.0 /100 | #29 | Exceptional 96.3% |
| Maltese | 100.0 /100 | #30 | Exceptional 96.3% |
| British | 100.0 /100 | #31 | Exceptional 96.3% |
| Belgians | 100.0 /100 | #32 | Exceptional 96.3% |
| Luxembourgers | 100.0 /100 | #33 | Exceptional 96.3% |
| Hungarians | 100.0 /100 | #34 | Exceptional 96.2% |
| Bulgarians | 99.9 /100 | #35 | Exceptional 96.2% |
| Northern Europeans | 99.9 /100 | #36 | Exceptional 96.2% |
| Estonians | 99.9 /100 | #37 | Exceptional 96.1% |
| Immigrants | Scotland | 99.9 /100 | #38 | Exceptional 96.1% |
| Ottawa | 99.9 /100 | #39 | Exceptional 96.1% |
| Slavs | 99.9 /100 | #40 | Exceptional 96.1% |
| Czechoslovakians | 99.9 /100 | #41 | Exceptional 96.1% |
| Chippewa | 99.9 /100 | #42 | Exceptional 96.1% |
| Iranians | 99.9 /100 | #43 | Exceptional 96.1% |
| Alaska Natives | 99.9 /100 | #44 | Exceptional 96.1% |