Immigrants from Korea vs Immigrants from Kenya 9th Grade
COMPARE
Immigrants from Korea
Immigrants from Kenya
9th Grade
9th Grade Comparison
Immigrants from Korea
Immigrants from Kenya
95.1%
9TH GRADE
79.6/ 100
METRIC RATING
149th/ 347
METRIC RANK
95.0%
9TH GRADE
73.1/ 100
METRIC RATING
156th/ 347
METRIC RANK
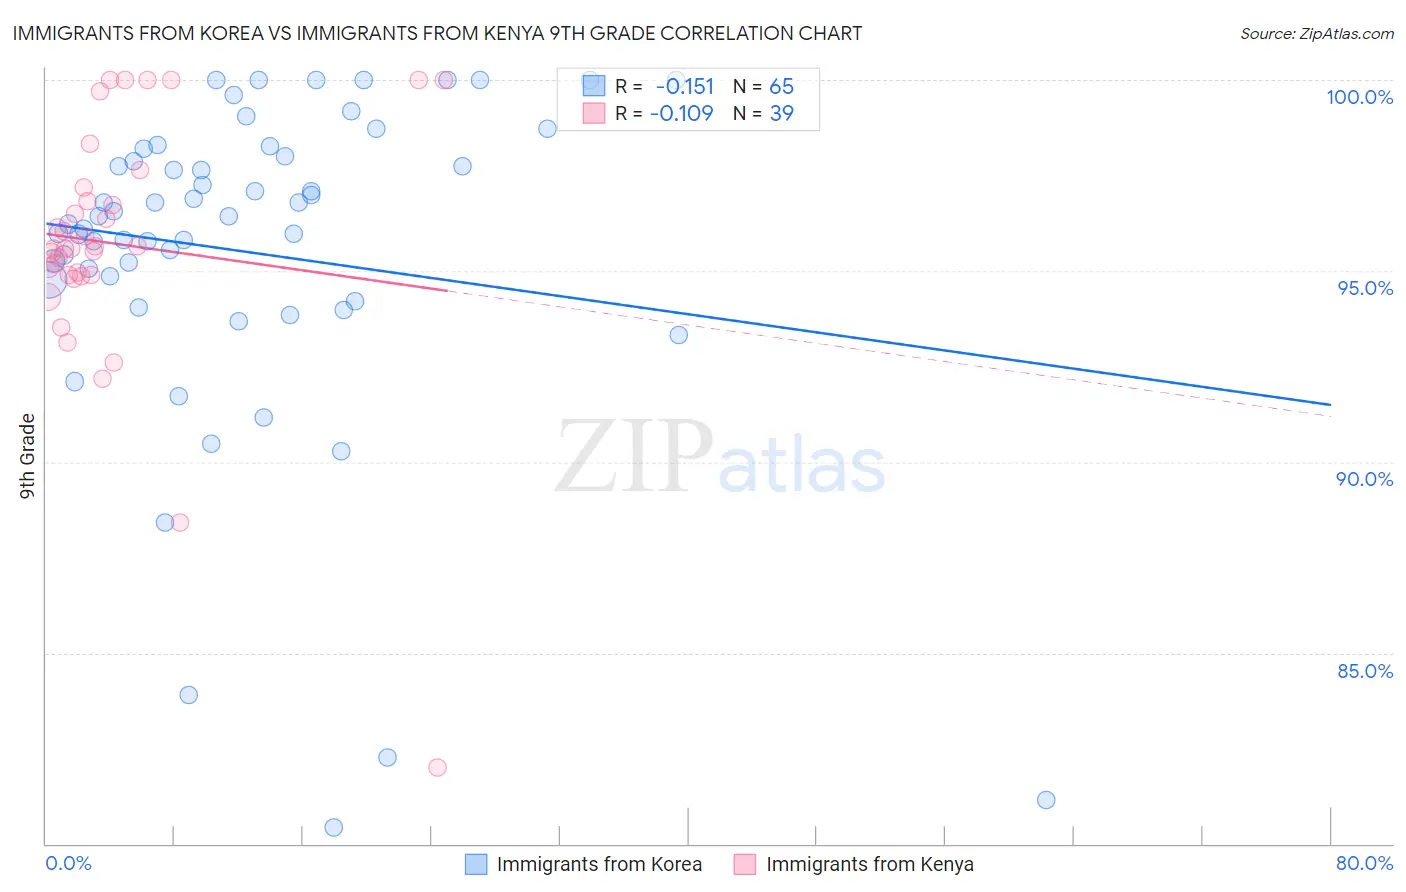
Immigrants from Korea vs Immigrants from Kenya 9th Grade Correlation Chart
The statistical analysis conducted on geographies consisting of 416,280,217 people shows a poor negative correlation between the proportion of Immigrants from Korea and percentage of population with at least 9th grade education in the United States with a correlation coefficient (R) of -0.151 and weighted average of 95.1%. Similarly, the statistical analysis conducted on geographies consisting of 218,076,690 people shows a poor negative correlation between the proportion of Immigrants from Kenya and percentage of population with at least 9th grade education in the United States with a correlation coefficient (R) of -0.109 and weighted average of 95.0%, a difference of 0.070%.
9th Grade Correlation Summary
| Measurement | Immigrants from Korea | Immigrants from Kenya |
| Minimum | 80.4% | 82.0% |
| Maximum | 100.0% | 100.0% |
| Range | 19.6% | 18.0% |
| Mean | 95.5% | 95.7% |
| Median | 96.4% | 95.6% |
| Interquartile 25% (IQ1) | 94.5% | 94.9% |
| Interquartile 75% (IQ3) | 98.1% | 97.2% |
| Interquartile Range (IQR) | 3.6% | 2.3% |
| Standard Deviation (Sample) | 4.4% | 3.3% |
| Standard Deviation (Population) | 4.3% | 3.3% |
Demographics Similar to Immigrants from Korea and Immigrants from Kenya by 9th Grade
In terms of 9th grade, the demographic groups most similar to Immigrants from Korea are Kenyan (95.1%, a difference of 0.010%), Immigrants from Jordan (95.1%, a difference of 0.020%), Cajun (95.1%, a difference of 0.020%), Pueblo (95.1%, a difference of 0.030%), and Immigrants from Sri Lanka (95.1%, a difference of 0.030%). Similarly, the demographic groups most similar to Immigrants from Kenya are Mongolian (95.0%, a difference of 0.0%), Arab (95.1%, a difference of 0.020%), Immigrants from Kazakhstan (95.1%, a difference of 0.020%), Albanian (95.1%, a difference of 0.030%), and Egyptian (95.0%, a difference of 0.030%).
| Demographics | Rating | Rank | 9th Grade |
| Immigrants | Greece | 84.6 /100 | #142 | Excellent 95.2% |
| Spanish | 84.4 /100 | #143 | Excellent 95.2% |
| Yup'ik | 83.3 /100 | #144 | Excellent 95.2% |
| Pueblo | 82.2 /100 | #145 | Excellent 95.1% |
| Immigrants | Sri Lanka | 82.1 /100 | #146 | Excellent 95.1% |
| Choctaw | 81.9 /100 | #147 | Excellent 95.1% |
| Immigrants | Jordan | 81.2 /100 | #148 | Excellent 95.1% |
| Immigrants | Korea | 79.6 /100 | #149 | Good 95.1% |
| Kenyans | 79.1 /100 | #150 | Good 95.1% |
| Cajuns | 77.3 /100 | #151 | Good 95.1% |
| Ugandans | 77.0 /100 | #152 | Good 95.1% |
| Albanians | 76.1 /100 | #153 | Good 95.1% |
| Arabs | 74.9 /100 | #154 | Good 95.1% |
| Immigrants | Kazakhstan | 74.7 /100 | #155 | Good 95.1% |
| Immigrants | Kenya | 73.1 /100 | #156 | Good 95.0% |
| Mongolians | 73.0 /100 | #157 | Good 95.0% |
| Egyptians | 70.1 /100 | #158 | Good 95.0% |
| Immigrants | Ukraine | 67.4 /100 | #159 | Good 95.0% |
| Immigrants | Italy | 66.6 /100 | #160 | Good 95.0% |
| French American Indians | 66.5 /100 | #161 | Good 95.0% |
| Bermudans | 65.8 /100 | #162 | Good 95.0% |