Latvian vs Immigrants from Congo 9th Grade
COMPARE
Latvian
Immigrants from Congo
9th Grade
9th Grade Comparison
Latvians
Immigrants from Congo
96.4%
9TH GRADE
100.0/ 100
METRIC RATING
24th/ 347
METRIC RANK
93.9%
9TH GRADE
0.4/ 100
METRIC RATING
264th/ 347
METRIC RANK
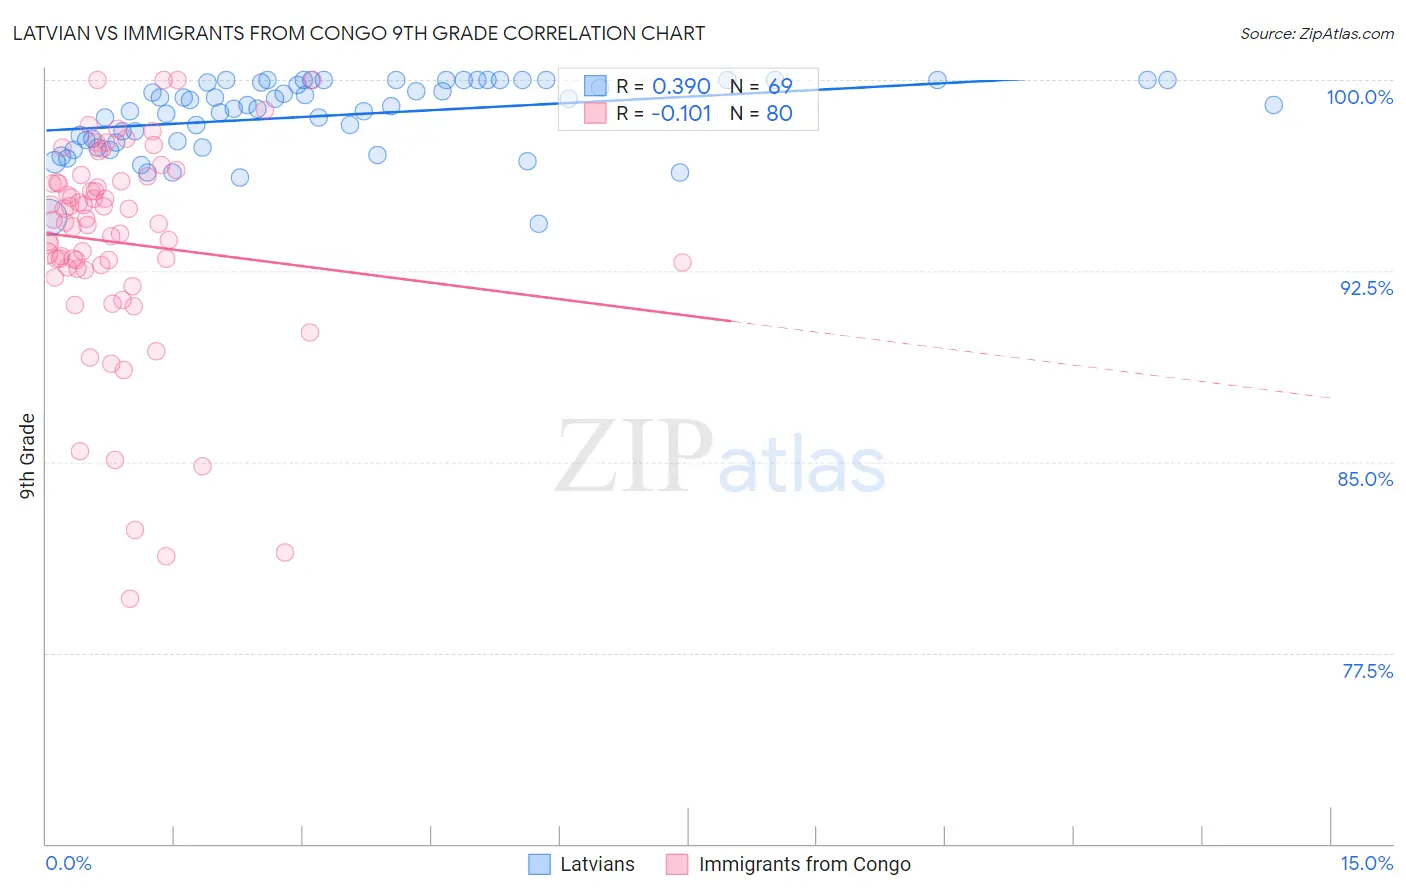
Latvian vs Immigrants from Congo 9th Grade Correlation Chart
The statistical analysis conducted on geographies consisting of 220,726,265 people shows a mild positive correlation between the proportion of Latvians and percentage of population with at least 9th grade education in the United States with a correlation coefficient (R) of 0.390 and weighted average of 96.4%. Similarly, the statistical analysis conducted on geographies consisting of 92,132,988 people shows a poor negative correlation between the proportion of Immigrants from Congo and percentage of population with at least 9th grade education in the United States with a correlation coefficient (R) of -0.101 and weighted average of 93.9%, a difference of 2.6%.
9th Grade Correlation Summary
| Measurement | Latvian | Immigrants from Congo |
| Minimum | 94.4% | 79.6% |
| Maximum | 100.0% | 100.0% |
| Range | 5.6% | 20.4% |
| Mean | 98.6% | 93.6% |
| Median | 99.0% | 94.4% |
| Interquartile 25% (IQ1) | 97.6% | 92.6% |
| Interquartile 75% (IQ3) | 100.0% | 96.0% |
| Interquartile Range (IQR) | 2.4% | 3.4% |
| Standard Deviation (Sample) | 1.4% | 4.2% |
| Standard Deviation (Population) | 1.4% | 4.2% |
Similar Demographics by 9th Grade
Demographics Similar to Latvians by 9th Grade
In terms of 9th grade, the demographic groups most similar to Latvians are French (96.3%, a difference of 0.010%), Czech (96.4%, a difference of 0.030%), European (96.4%, a difference of 0.040%), French Canadian (96.3%, a difference of 0.040%), and Alaskan Athabascan (96.4%, a difference of 0.050%).
| Demographics | Rating | Rank | 9th Grade |
| Dutch | 100.0 /100 | #17 | Exceptional 96.5% |
| Scandinavians | 100.0 /100 | #18 | Exceptional 96.5% |
| Welsh | 100.0 /100 | #19 | Exceptional 96.4% |
| Italians | 100.0 /100 | #20 | Exceptional 96.4% |
| Alaskan Athabascans | 100.0 /100 | #21 | Exceptional 96.4% |
| Europeans | 100.0 /100 | #22 | Exceptional 96.4% |
| Czechs | 100.0 /100 | #23 | Exceptional 96.4% |
| Latvians | 100.0 /100 | #24 | Exceptional 96.4% |
| French | 100.0 /100 | #25 | Exceptional 96.3% |
| French Canadians | 100.0 /100 | #26 | Exceptional 96.3% |
| Scotch-Irish | 100.0 /100 | #27 | Exceptional 96.3% |
| Eastern Europeans | 100.0 /100 | #28 | Exceptional 96.3% |
| Chinese | 100.0 /100 | #29 | Exceptional 96.3% |
| Maltese | 100.0 /100 | #30 | Exceptional 96.3% |
| British | 100.0 /100 | #31 | Exceptional 96.3% |
Demographics Similar to Immigrants from Congo by 9th Grade
In terms of 9th grade, the demographic groups most similar to Immigrants from Congo are Immigrants from Uzbekistan (93.9%, a difference of 0.0%), Native/Alaskan (93.9%, a difference of 0.0%), Immigrants from Jamaica (93.9%, a difference of 0.010%), Navajo (93.9%, a difference of 0.010%), and South American (93.9%, a difference of 0.030%).
| Demographics | Rating | Rank | 9th Grade |
| Immigrants | Costa Rica | 0.5 /100 | #257 | Tragic 94.0% |
| Immigrants | Thailand | 0.5 /100 | #258 | Tragic 93.9% |
| Ghanaians | 0.5 /100 | #259 | Tragic 93.9% |
| Pima | 0.4 /100 | #260 | Tragic 93.9% |
| South Americans | 0.4 /100 | #261 | Tragic 93.9% |
| Immigrants | Jamaica | 0.4 /100 | #262 | Tragic 93.9% |
| Immigrants | Uzbekistan | 0.4 /100 | #263 | Tragic 93.9% |
| Immigrants | Congo | 0.4 /100 | #264 | Tragic 93.9% |
| Natives/Alaskans | 0.4 /100 | #265 | Tragic 93.9% |
| Navajo | 0.3 /100 | #266 | Tragic 93.9% |
| Armenians | 0.3 /100 | #267 | Tragic 93.9% |
| Immigrants | Bolivia | 0.3 /100 | #268 | Tragic 93.9% |
| Immigrants | Uruguay | 0.2 /100 | #269 | Tragic 93.8% |
| Yuman | 0.2 /100 | #270 | Tragic 93.8% |
| Immigrants | Ghana | 0.2 /100 | #271 | Tragic 93.8% |