Laotian vs Immigrants from Czechoslovakia College, Under 1 year
COMPARE
Laotian
Immigrants from Czechoslovakia
College, Under 1 year
College, Under 1 year Comparison
Laotians
Immigrants from Czechoslovakia
68.5%
COLLEGE, UNDER 1 YEAR
98.6/ 100
METRIC RATING
76th/ 347
METRIC RANK
69.6%
COLLEGE, UNDER 1 YEAR
99.7/ 100
METRIC RATING
54th/ 347
METRIC RANK
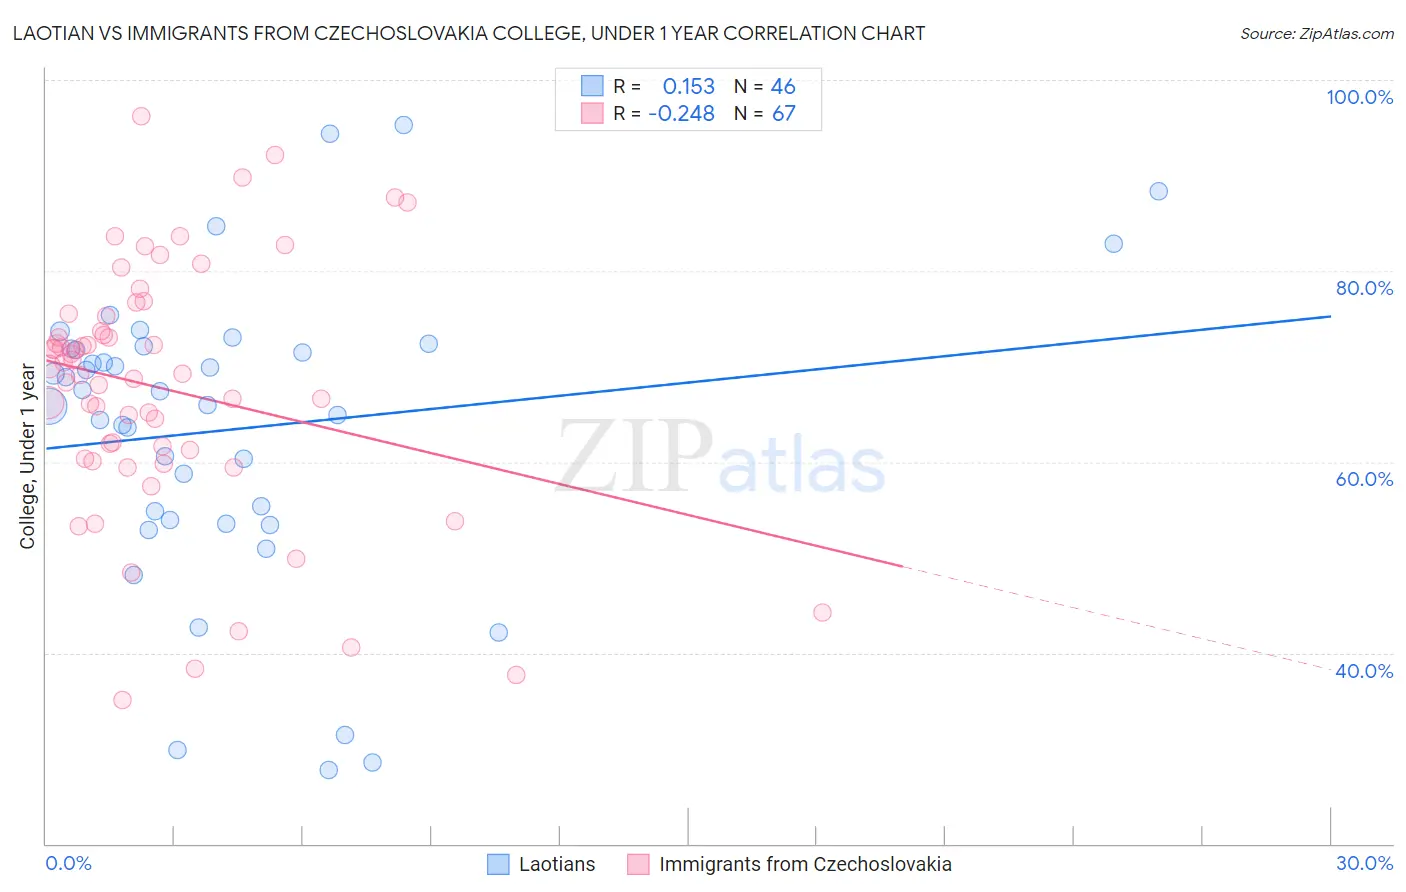
Laotian vs Immigrants from Czechoslovakia College, Under 1 year Correlation Chart
The statistical analysis conducted on geographies consisting of 224,861,279 people shows a poor positive correlation between the proportion of Laotians and percentage of population with at least college, under 1 year education in the United States with a correlation coefficient (R) of 0.153 and weighted average of 68.5%. Similarly, the statistical analysis conducted on geographies consisting of 195,448,477 people shows a weak negative correlation between the proportion of Immigrants from Czechoslovakia and percentage of population with at least college, under 1 year education in the United States with a correlation coefficient (R) of -0.248 and weighted average of 69.6%, a difference of 1.6%.
College, Under 1 year Correlation Summary
| Measurement | Laotian | Immigrants from Czechoslovakia |
| Minimum | 27.8% | 35.1% |
| Maximum | 95.2% | 96.2% |
| Range | 67.5% | 61.1% |
| Mean | 63.4% | 67.6% |
| Median | 66.6% | 69.2% |
| Interquartile 25% (IQ1) | 53.9% | 60.4% |
| Interquartile 75% (IQ3) | 71.9% | 75.3% |
| Interquartile Range (IQR) | 18.0% | 14.9% |
| Standard Deviation (Sample) | 15.7% | 13.2% |
| Standard Deviation (Population) | 15.5% | 13.1% |
Similar Demographics by College, Under 1 year
Demographics Similar to Laotians by College, Under 1 year
In terms of college, under 1 year, the demographic groups most similar to Laotians are Immigrants from Western Europe (68.5%, a difference of 0.0%), British (68.5%, a difference of 0.040%), Danish (68.5%, a difference of 0.050%), Greek (68.5%, a difference of 0.070%), and Immigrants from Spain (68.4%, a difference of 0.090%).
| Demographics | Rating | Rank | College, Under 1 year |
| Immigrants | Romania | 99.2 /100 | #69 | Exceptional 68.9% |
| Lithuanians | 99.1 /100 | #70 | Exceptional 68.8% |
| Immigrants | Europe | 99.1 /100 | #71 | Exceptional 68.8% |
| Bolivians | 99.0 /100 | #72 | Exceptional 68.7% |
| Immigrants | England | 99.0 /100 | #73 | Exceptional 68.7% |
| Swedes | 98.9 /100 | #74 | Exceptional 68.7% |
| Immigrants | Western Europe | 98.6 /100 | #75 | Exceptional 68.5% |
| Laotians | 98.6 /100 | #76 | Exceptional 68.5% |
| British | 98.6 /100 | #77 | Exceptional 68.5% |
| Danes | 98.6 /100 | #78 | Exceptional 68.5% |
| Greeks | 98.6 /100 | #79 | Exceptional 68.5% |
| Immigrants | Spain | 98.5 /100 | #80 | Exceptional 68.4% |
| Immigrants | Greece | 98.5 /100 | #81 | Exceptional 68.4% |
| Norwegians | 98.4 /100 | #82 | Exceptional 68.4% |
| Argentineans | 98.4 /100 | #83 | Exceptional 68.4% |
Demographics Similar to Immigrants from Czechoslovakia by College, Under 1 year
In terms of college, under 1 year, the demographic groups most similar to Immigrants from Czechoslovakia are Maltese (69.5%, a difference of 0.10%), South African (69.7%, a difference of 0.12%), Immigrants from Scotland (69.4%, a difference of 0.22%), Asian (69.4%, a difference of 0.25%), and Immigrants from Malaysia (69.3%, a difference of 0.34%).
| Demographics | Rating | Rank | College, Under 1 year |
| Immigrants | Bulgaria | 99.8 /100 | #47 | Exceptional 70.0% |
| Immigrants | Netherlands | 99.8 /100 | #48 | Exceptional 70.0% |
| Immigrants | Austria | 99.8 /100 | #49 | Exceptional 70.0% |
| Zimbabweans | 99.8 /100 | #50 | Exceptional 69.9% |
| Mongolians | 99.8 /100 | #51 | Exceptional 69.9% |
| Immigrants | Russia | 99.8 /100 | #52 | Exceptional 69.9% |
| South Africans | 99.7 /100 | #53 | Exceptional 69.7% |
| Immigrants | Czechoslovakia | 99.7 /100 | #54 | Exceptional 69.6% |
| Maltese | 99.7 /100 | #55 | Exceptional 69.5% |
| Immigrants | Scotland | 99.6 /100 | #56 | Exceptional 69.4% |
| Asians | 99.6 /100 | #57 | Exceptional 69.4% |
| Immigrants | Malaysia | 99.6 /100 | #58 | Exceptional 69.3% |
| Immigrants | Serbia | 99.5 /100 | #59 | Exceptional 69.3% |
| Immigrants | Asia | 99.5 /100 | #60 | Exceptional 69.2% |
| Immigrants | Kazakhstan | 99.5 /100 | #61 | Exceptional 69.2% |