Korean vs Icelander GED/Equivalency
COMPARE
Korean
Icelander
GED/Equivalency
GED/Equivalency Comparison
Koreans
Icelanders
85.6%
GED/EQUIVALENCY
41.2/ 100
METRIC RATING
178th/ 347
METRIC RANK
87.1%
GED/EQUIVALENCY
95.7/ 100
METRIC RATING
107th/ 347
METRIC RANK
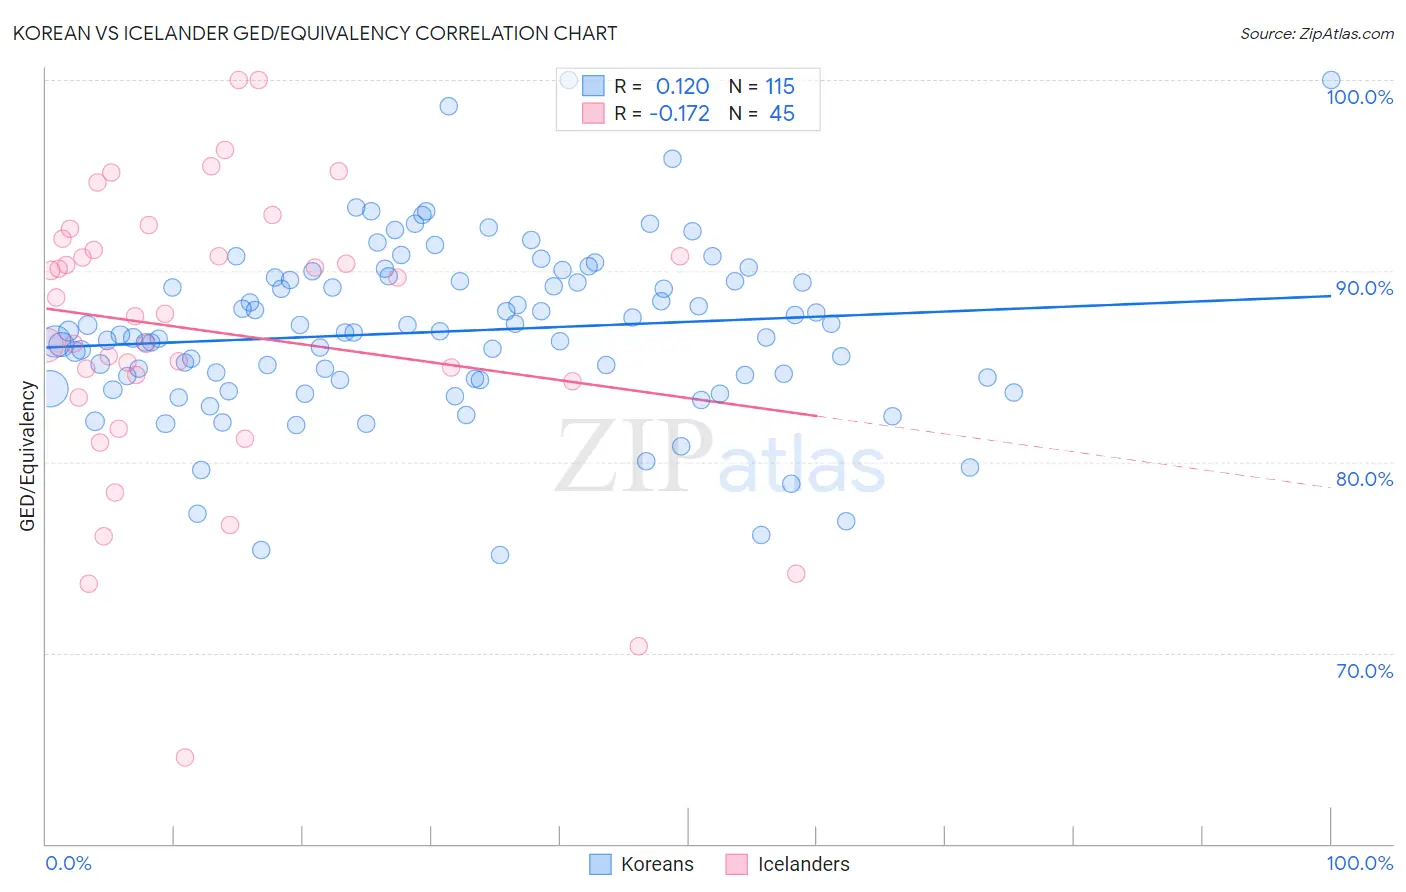
Korean vs Icelander GED/Equivalency Correlation Chart
The statistical analysis conducted on geographies consisting of 510,944,156 people shows a poor positive correlation between the proportion of Koreans and percentage of population with at least ged/equivalency education in the United States with a correlation coefficient (R) of 0.120 and weighted average of 85.6%. Similarly, the statistical analysis conducted on geographies consisting of 159,668,816 people shows a poor negative correlation between the proportion of Icelanders and percentage of population with at least ged/equivalency education in the United States with a correlation coefficient (R) of -0.172 and weighted average of 87.1%, a difference of 1.8%.
GED/Equivalency Correlation Summary
| Measurement | Korean | Icelander |
| Minimum | 75.1% | 64.5% |
| Maximum | 100.0% | 100.0% |
| Range | 24.9% | 35.5% |
| Mean | 86.8% | 86.9% |
| Median | 86.8% | 87.7% |
| Interquartile 25% (IQ1) | 84.3% | 83.8% |
| Interquartile 75% (IQ3) | 89.5% | 91.4% |
| Interquartile Range (IQR) | 5.2% | 7.6% |
| Standard Deviation (Sample) | 4.5% | 7.5% |
| Standard Deviation (Population) | 4.5% | 7.4% |
Similar Demographics by GED/Equivalency
Demographics Similar to Koreans by GED/Equivalency
In terms of ged/equivalency, the demographic groups most similar to Koreans are Aleut (85.6%, a difference of 0.020%), Immigrants from Southern Europe (85.5%, a difference of 0.060%), Immigrants from Uganda (85.7%, a difference of 0.080%), Moroccan (85.5%, a difference of 0.080%), and Immigrants from Eastern Africa (85.7%, a difference of 0.13%).
| Demographics | Rating | Rank | GED/Equivalency |
| Immigrants | Chile | 57.3 /100 | #171 | Average 85.9% |
| Bermudans | 55.1 /100 | #172 | Average 85.8% |
| Immigrants | Venezuela | 50.7 /100 | #173 | Average 85.8% |
| Ottawa | 50.0 /100 | #174 | Average 85.8% |
| Immigrants | Bolivia | 49.8 /100 | #175 | Average 85.8% |
| Immigrants | Eastern Africa | 47.7 /100 | #176 | Average 85.7% |
| Immigrants | Uganda | 45.2 /100 | #177 | Average 85.7% |
| Koreans | 41.2 /100 | #178 | Average 85.6% |
| Aleuts | 40.5 /100 | #179 | Average 85.6% |
| Immigrants | Southern Europe | 38.4 /100 | #180 | Fair 85.5% |
| Moroccans | 37.7 /100 | #181 | Fair 85.5% |
| Sudanese | 35.2 /100 | #182 | Fair 85.5% |
| Immigrants | Sudan | 34.2 /100 | #183 | Fair 85.5% |
| Immigrants | Oceania | 33.6 /100 | #184 | Fair 85.5% |
| Spanish | 32.8 /100 | #185 | Fair 85.4% |
Demographics Similar to Icelanders by GED/Equivalency
In terms of ged/equivalency, the demographic groups most similar to Icelanders are Immigrants from Zimbabwe (87.1%, a difference of 0.010%), Indian (Asian) (87.1%, a difference of 0.020%), Canadian (87.1%, a difference of 0.020%), Immigrants from Hungary (87.2%, a difference of 0.030%), and Immigrants from Eastern Europe (87.1%, a difference of 0.030%).
| Demographics | Rating | Rank | GED/Equivalency |
| Palestinians | 96.8 /100 | #100 | Exceptional 87.3% |
| Syrians | 96.6 /100 | #101 | Exceptional 87.2% |
| Lebanese | 96.2 /100 | #102 | Exceptional 87.2% |
| Jordanians | 96.1 /100 | #103 | Exceptional 87.2% |
| Immigrants | Hungary | 96.0 /100 | #104 | Exceptional 87.2% |
| Indians (Asian) | 95.9 /100 | #105 | Exceptional 87.1% |
| Immigrants | Zimbabwe | 95.8 /100 | #106 | Exceptional 87.1% |
| Icelanders | 95.7 /100 | #107 | Exceptional 87.1% |
| Canadians | 95.6 /100 | #108 | Exceptional 87.1% |
| Immigrants | Eastern Europe | 95.5 /100 | #109 | Exceptional 87.1% |
| Egyptians | 95.3 /100 | #110 | Exceptional 87.1% |
| French | 95.2 /100 | #111 | Exceptional 87.1% |
| Tlingit-Haida | 94.8 /100 | #112 | Exceptional 87.0% |
| Assyrians/Chaldeans/Syriacs | 94.8 /100 | #113 | Exceptional 87.0% |
| Immigrants | Kazakhstan | 94.7 /100 | #114 | Exceptional 87.0% |