Korean vs Uruguayan 10th Grade
COMPARE
Korean
Uruguayan
10th Grade
10th Grade Comparison
Koreans
Uruguayans
93.2%
10TH GRADE
6.1/ 100
METRIC RATING
226th/ 347
METRIC RANK
92.9%
10TH GRADE
1.8/ 100
METRIC RATING
245th/ 347
METRIC RANK
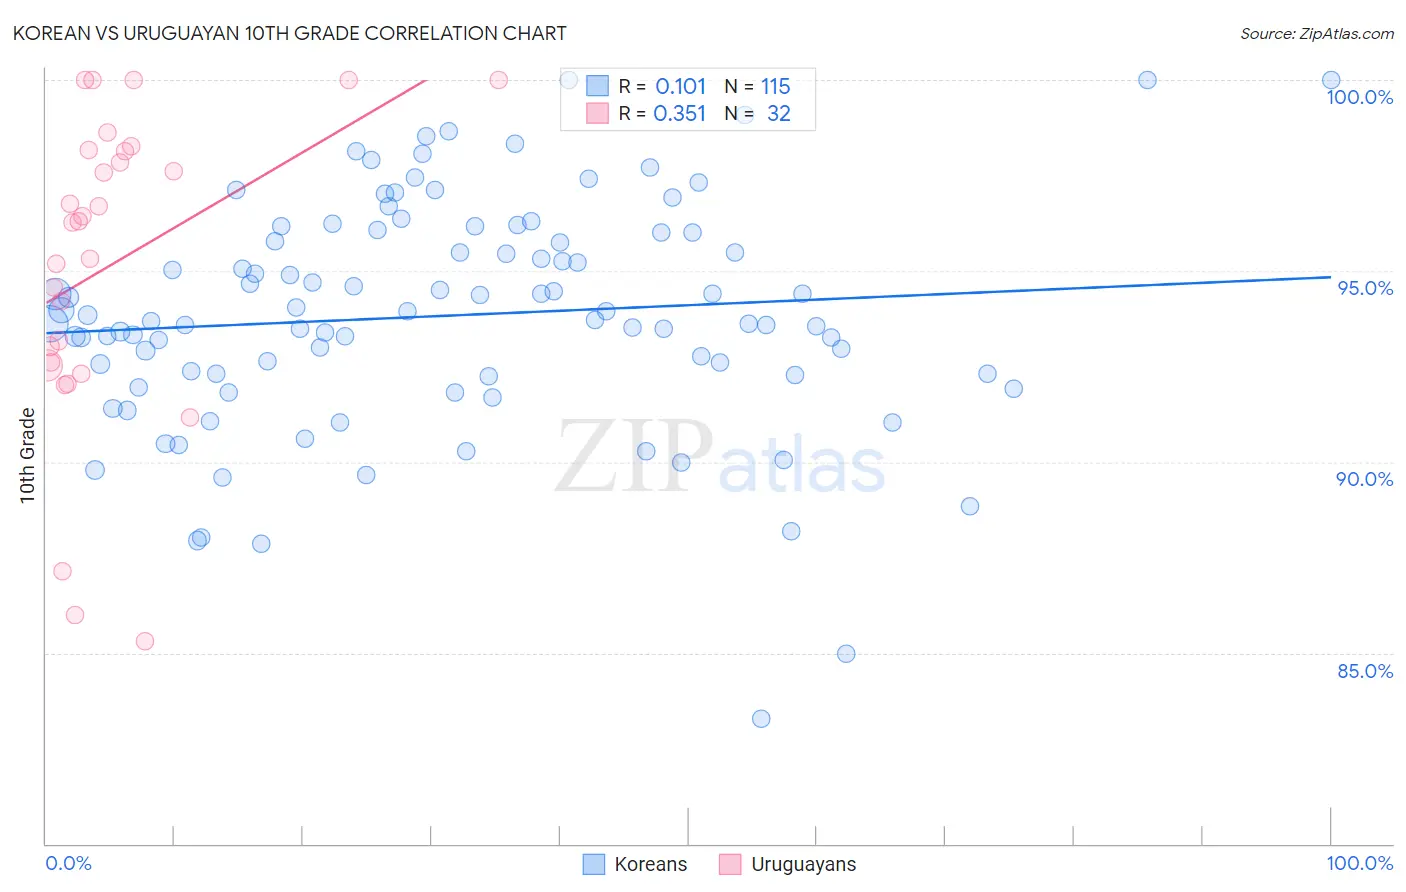
Korean vs Uruguayan 10th Grade Correlation Chart
The statistical analysis conducted on geographies consisting of 510,943,943 people shows a poor positive correlation between the proportion of Koreans and percentage of population with at least 10th grade education in the United States with a correlation coefficient (R) of 0.101 and weighted average of 93.2%. Similarly, the statistical analysis conducted on geographies consisting of 144,782,794 people shows a mild positive correlation between the proportion of Uruguayans and percentage of population with at least 10th grade education in the United States with a correlation coefficient (R) of 0.351 and weighted average of 92.9%, a difference of 0.28%.
10th Grade Correlation Summary
| Measurement | Korean | Uruguayan |
| Minimum | 83.3% | 85.3% |
| Maximum | 100.0% | 100.0% |
| Range | 16.7% | 14.7% |
| Mean | 93.8% | 95.2% |
| Median | 93.7% | 96.3% |
| Interquartile 25% (IQ1) | 92.3% | 92.6% |
| Interquartile 75% (IQ3) | 96.0% | 98.1% |
| Interquartile Range (IQR) | 3.7% | 5.6% |
| Standard Deviation (Sample) | 3.0% | 4.0% |
| Standard Deviation (Population) | 3.0% | 3.9% |
Demographics Similar to Koreans and Uruguayans by 10th Grade
In terms of 10th grade, the demographic groups most similar to Koreans are Somali (93.2%, a difference of 0.0%), Black/African American (93.2%, a difference of 0.0%), Immigrants from China (93.2%, a difference of 0.010%), Immigrants from Ethiopia (93.1%, a difference of 0.040%), and Immigrants from Africa (93.1%, a difference of 0.050%). Similarly, the demographic groups most similar to Uruguayans are Spanish American (92.9%, a difference of 0.030%), Senegalese (93.0%, a difference of 0.060%), Immigrants from Somalia (93.0%, a difference of 0.080%), Immigrants from Cameroon (93.0%, a difference of 0.080%), and Nigerian (93.1%, a difference of 0.19%).
| Demographics | Rating | Rank | 10th Grade |
| Somalis | 6.2 /100 | #225 | Tragic 93.2% |
| Koreans | 6.1 /100 | #226 | Tragic 93.2% |
| Blacks/African Americans | 6.0 /100 | #227 | Tragic 93.2% |
| Immigrants | China | 5.9 /100 | #228 | Tragic 93.2% |
| Immigrants | Ethiopia | 5.1 /100 | #229 | Tragic 93.1% |
| Immigrants | Africa | 5.0 /100 | #230 | Tragic 93.1% |
| South American Indians | 4.9 /100 | #231 | Tragic 93.1% |
| Bahamians | 4.9 /100 | #232 | Tragic 93.1% |
| Comanche | 4.9 /100 | #233 | Tragic 93.1% |
| Sub-Saharan Africans | 4.7 /100 | #234 | Tragic 93.1% |
| Africans | 4.6 /100 | #235 | Tragic 93.1% |
| Afghans | 4.5 /100 | #236 | Tragic 93.1% |
| Immigrants | Panama | 4.3 /100 | #237 | Tragic 93.1% |
| Nigerians | 4.2 /100 | #238 | Tragic 93.1% |
| Costa Ricans | 4.2 /100 | #239 | Tragic 93.1% |
| Immigrants | Hong Kong | 4.2 /100 | #240 | Tragic 93.1% |
| Immigrants | Somalia | 2.7 /100 | #241 | Tragic 93.0% |
| Immigrants | Cameroon | 2.6 /100 | #242 | Tragic 93.0% |
| Senegalese | 2.4 /100 | #243 | Tragic 93.0% |
| Spanish Americans | 2.1 /100 | #244 | Tragic 92.9% |
| Uruguayans | 1.8 /100 | #245 | Tragic 92.9% |