Immigrants from Syria vs Sierra Leonean 2nd Grade
COMPARE
Immigrants from Syria
Sierra Leonean
2nd Grade
2nd Grade Comparison
Immigrants from Syria
Sierra Leoneans
97.6%
2ND GRADE
4.0/ 100
METRIC RATING
226th/ 347
METRIC RANK
97.6%
2ND GRADE
4.3/ 100
METRIC RATING
223rd/ 347
METRIC RANK
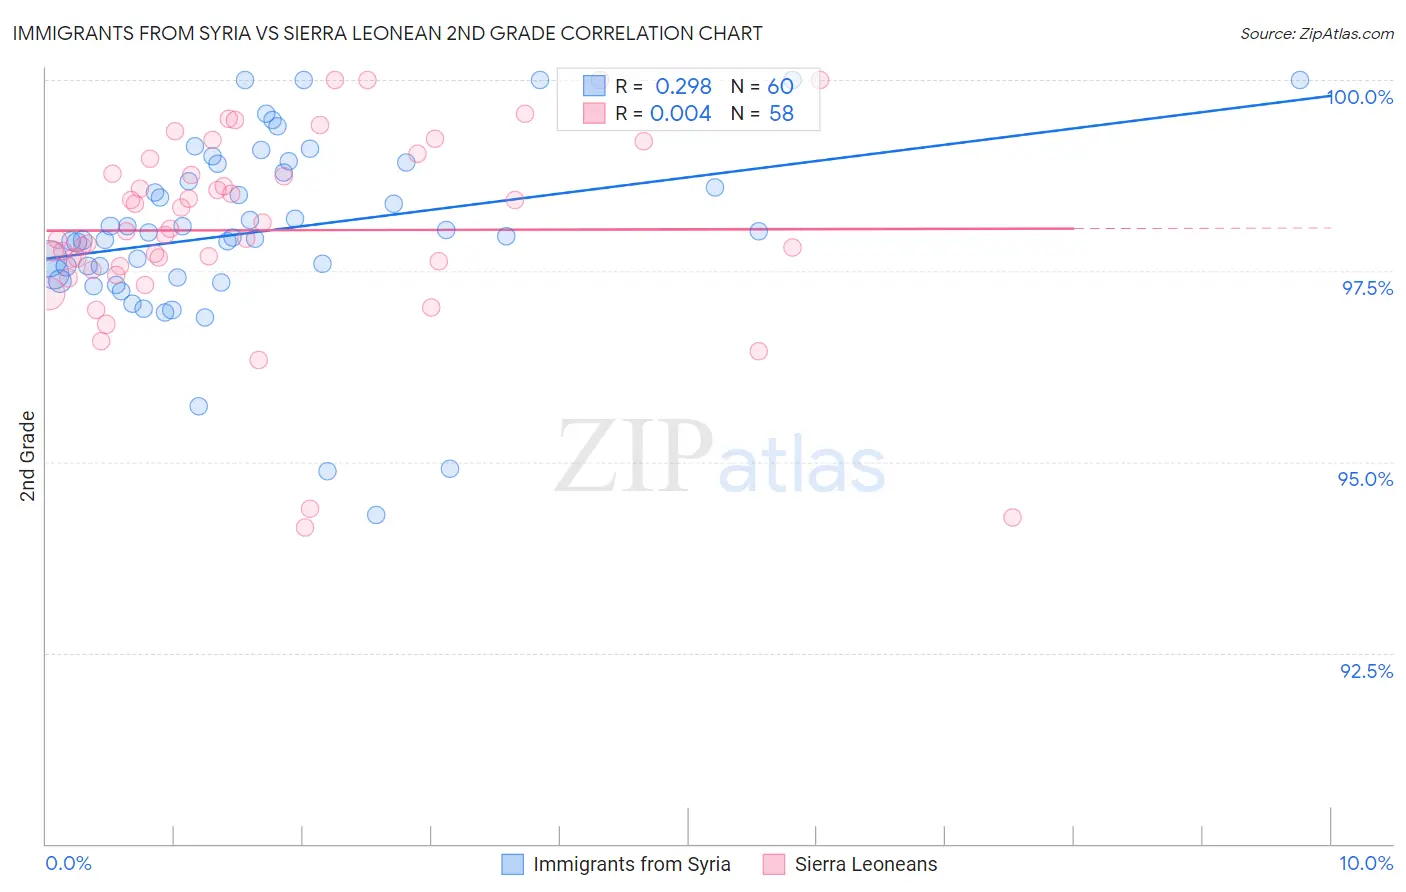
Immigrants from Syria vs Sierra Leonean 2nd Grade Correlation Chart
The statistical analysis conducted on geographies consisting of 174,108,374 people shows a weak positive correlation between the proportion of Immigrants from Syria and percentage of population with at least 2nd grade education in the United States with a correlation coefficient (R) of 0.298 and weighted average of 97.6%. Similarly, the statistical analysis conducted on geographies consisting of 83,337,655 people shows no correlation between the proportion of Sierra Leoneans and percentage of population with at least 2nd grade education in the United States with a correlation coefficient (R) of 0.004 and weighted average of 97.6%, a difference of 0.010%.
2nd Grade Correlation Summary
| Measurement | Immigrants from Syria | Sierra Leonean |
| Minimum | 94.3% | 94.1% |
| Maximum | 100.0% | 100.0% |
| Range | 5.7% | 5.9% |
| Mean | 98.0% | 98.0% |
| Median | 98.0% | 98.0% |
| Interquartile 25% (IQ1) | 97.4% | 97.6% |
| Interquartile 75% (IQ3) | 98.8% | 98.8% |
| Interquartile Range (IQR) | 1.4% | 1.2% |
| Standard Deviation (Sample) | 1.2% | 1.3% |
| Standard Deviation (Population) | 1.2% | 1.3% |
Demographics Similar to Immigrants from Syria and Sierra Leoneans by 2nd Grade
In terms of 2nd grade, the demographic groups most similar to Immigrants from Syria are Immigrants from Nepal (97.6%, a difference of 0.0%), Iraqi (97.6%, a difference of 0.010%), Immigrants from Sudan (97.6%, a difference of 0.010%), Immigrants from Zaire (97.6%, a difference of 0.010%), and Tongan (97.6%, a difference of 0.010%). Similarly, the demographic groups most similar to Sierra Leoneans are Immigrants from Sudan (97.6%, a difference of 0.0%), Immigrants from Zaire (97.6%, a difference of 0.0%), Tongan (97.6%, a difference of 0.0%), Immigrants from Morocco (97.6%, a difference of 0.010%), and Iraqi (97.6%, a difference of 0.010%).
| Demographics | Rating | Rank | 2nd Grade |
| Samoans | 7.1 /100 | #214 | Tragic 97.7% |
| Bahamians | 6.8 /100 | #215 | Tragic 97.7% |
| South American Indians | 6.7 /100 | #216 | Tragic 97.7% |
| Uruguayans | 6.2 /100 | #217 | Tragic 97.7% |
| Sudanese | 5.7 /100 | #218 | Tragic 97.7% |
| Immigrants | Panama | 5.1 /100 | #219 | Tragic 97.6% |
| Immigrants | Morocco | 5.0 /100 | #220 | Tragic 97.6% |
| Iraqis | 4.6 /100 | #221 | Tragic 97.6% |
| Immigrants | Sudan | 4.5 /100 | #222 | Tragic 97.6% |
| Sierra Leoneans | 4.3 /100 | #223 | Tragic 97.6% |
| Immigrants | Zaire | 4.3 /100 | #224 | Tragic 97.6% |
| Tongans | 4.3 /100 | #225 | Tragic 97.6% |
| Immigrants | Syria | 4.0 /100 | #226 | Tragic 97.6% |
| Immigrants | Nepal | 4.0 /100 | #227 | Tragic 97.6% |
| Sub-Saharan Africans | 3.4 /100 | #228 | Tragic 97.6% |
| Immigrants | Costa Rica | 3.1 /100 | #229 | Tragic 97.6% |
| Senegalese | 3.1 /100 | #230 | Tragic 97.6% |
| Immigrants | Pakistan | 2.3 /100 | #231 | Tragic 97.6% |
| Immigrants | Western Asia | 2.1 /100 | #232 | Tragic 97.6% |
| Immigrants | Uruguay | 2.1 /100 | #233 | Tragic 97.6% |
| Immigrants | Malaysia | 2.0 /100 | #234 | Tragic 97.6% |