Korean vs Sierra Leonean Householder Income Under 25 years
COMPARE
Korean
Sierra Leonean
Householder Income Under 25 years
Householder Income Under 25 years Comparison
Koreans
Sierra Leoneans
$57,730
HOUSEHOLDER INCOME UNDER 25 YEARS
100.0/ 100
METRIC RATING
15th/ 347
METRIC RANK
$57,272
HOUSEHOLDER INCOME UNDER 25 YEARS
100.0/ 100
METRIC RATING
17th/ 347
METRIC RANK
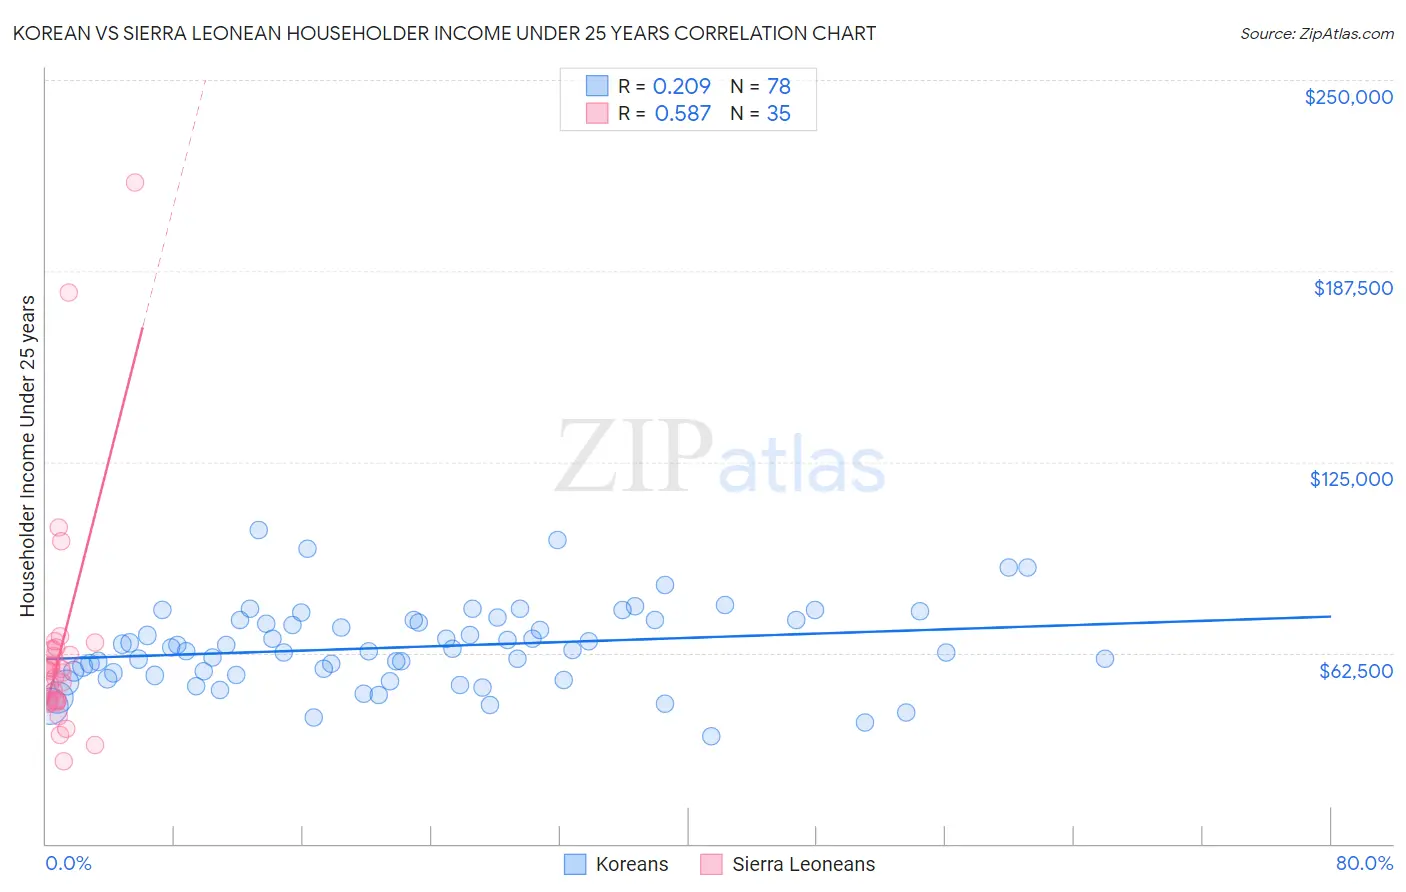
Korean vs Sierra Leonean Householder Income Under 25 years Correlation Chart
The statistical analysis conducted on geographies consisting of 413,031,760 people shows a weak positive correlation between the proportion of Koreans and household income with householder under the age of 25 in the United States with a correlation coefficient (R) of 0.209 and weighted average of $57,730. Similarly, the statistical analysis conducted on geographies consisting of 78,503,409 people shows a substantial positive correlation between the proportion of Sierra Leoneans and household income with householder under the age of 25 in the United States with a correlation coefficient (R) of 0.587 and weighted average of $57,272, a difference of 0.80%.
Householder Income Under 25 years Correlation Summary
| Measurement | Korean | Sierra Leonean |
| Minimum | $35,240 | $26,847 |
| Maximum | $102,679 | $216,509 |
| Range | $67,439 | $189,662 |
| Mean | $64,423 | $63,601 |
| Median | $63,619 | $56,595 |
| Interquartile 25% (IQ1) | $55,260 | $46,837 |
| Interquartile 75% (IQ3) | $73,277 | $63,925 |
| Interquartile Range (IQR) | $18,017 | $17,087 |
| Standard Deviation (Sample) | $13,448 | $37,157 |
| Standard Deviation (Population) | $13,362 | $36,623 |
Demographics Similar to Koreans and Sierra Leoneans by Householder Income Under 25 years
In terms of householder income under 25 years, the demographic groups most similar to Koreans are Filipino ($57,740, a difference of 0.020%), Immigrants from South Central Asia ($57,818, a difference of 0.15%), Immigrants from China ($57,931, a difference of 0.35%), Immigrants from Philippines ($57,930, a difference of 0.35%), and Immigrants from Afghanistan ($57,478, a difference of 0.44%). Similarly, the demographic groups most similar to Sierra Leoneans are Immigrants from Eastern Asia ($57,123, a difference of 0.26%), Bhutanese ($57,078, a difference of 0.34%), Immigrants from Ireland ($57,075, a difference of 0.35%), Immigrants from Fiji ($57,074, a difference of 0.35%), and Immigrants from Afghanistan ($57,478, a difference of 0.36%).
| Demographics | Rating | Rank | Householder Income Under 25 years |
| Thais | 100.0 /100 | #6 | Exceptional $59,187 |
| Bolivians | 100.0 /100 | #7 | Exceptional $58,506 |
| Indians (Asian) | 100.0 /100 | #8 | Exceptional $58,239 |
| Chinese | 100.0 /100 | #9 | Exceptional $58,162 |
| Afghans | 100.0 /100 | #10 | Exceptional $58,019 |
| Immigrants | China | 100.0 /100 | #11 | Exceptional $57,931 |
| Immigrants | Philippines | 100.0 /100 | #12 | Exceptional $57,930 |
| Immigrants | South Central Asia | 100.0 /100 | #13 | Exceptional $57,818 |
| Filipinos | 100.0 /100 | #14 | Exceptional $57,740 |
| Koreans | 100.0 /100 | #15 | Exceptional $57,730 |
| Immigrants | Afghanistan | 100.0 /100 | #16 | Exceptional $57,478 |
| Sierra Leoneans | 100.0 /100 | #17 | Exceptional $57,272 |
| Immigrants | Eastern Asia | 100.0 /100 | #18 | Exceptional $57,123 |
| Bhutanese | 100.0 /100 | #19 | Exceptional $57,078 |
| Immigrants | Ireland | 100.0 /100 | #20 | Exceptional $57,075 |
| Immigrants | Fiji | 100.0 /100 | #21 | Exceptional $57,074 |
| Asians | 100.0 /100 | #22 | Exceptional $57,003 |
| Tongans | 100.0 /100 | #23 | Exceptional $56,972 |
| Immigrants | Singapore | 100.0 /100 | #24 | Exceptional $56,835 |
| Immigrants | Pakistan | 100.0 /100 | #25 | Exceptional $56,789 |
| Immigrants | Australia | 100.0 /100 | #26 | Exceptional $56,660 |