Korean vs Panamanian 9th Grade
COMPARE
Korean
Panamanian
9th Grade
9th Grade Comparison
Koreans
Panamanians
94.3%
9TH GRADE
2.9/ 100
METRIC RATING
237th/ 347
METRIC RANK
94.7%
9TH GRADE
29.0/ 100
METRIC RATING
194th/ 347
METRIC RANK
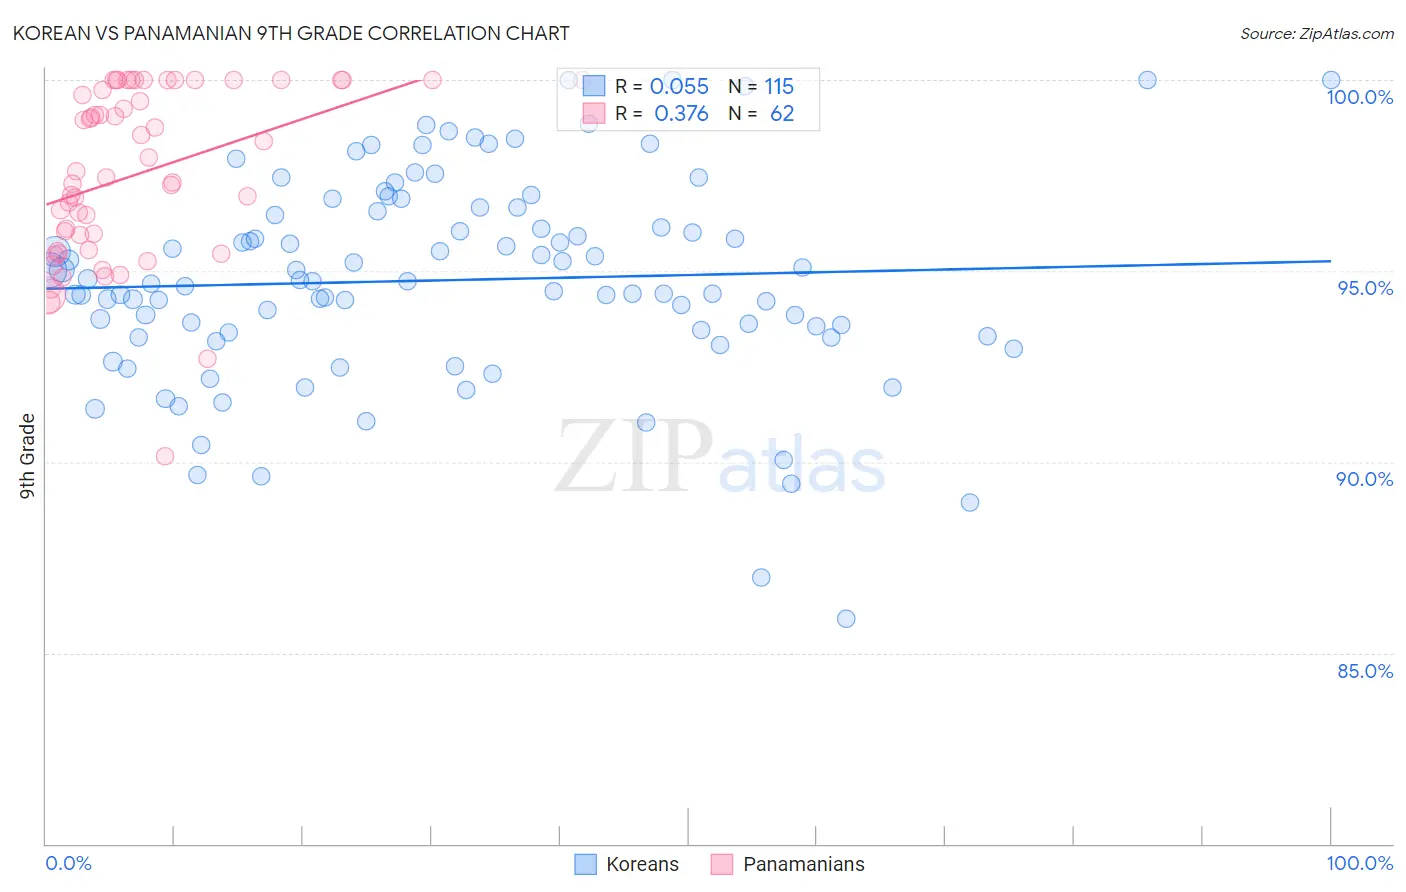
Korean vs Panamanian 9th Grade Correlation Chart
The statistical analysis conducted on geographies consisting of 510,943,943 people shows a slight positive correlation between the proportion of Koreans and percentage of population with at least 9th grade education in the United States with a correlation coefficient (R) of 0.055 and weighted average of 94.3%. Similarly, the statistical analysis conducted on geographies consisting of 281,248,945 people shows a mild positive correlation between the proportion of Panamanians and percentage of population with at least 9th grade education in the United States with a correlation coefficient (R) of 0.376 and weighted average of 94.7%, a difference of 0.49%.
9th Grade Correlation Summary
| Measurement | Korean | Panamanian |
| Minimum | 85.9% | 90.1% |
| Maximum | 100.0% | 100.0% |
| Range | 14.1% | 9.9% |
| Mean | 94.8% | 97.5% |
| Median | 94.7% | 97.5% |
| Interquartile 25% (IQ1) | 93.3% | 95.5% |
| Interquartile 75% (IQ3) | 96.5% | 100.0% |
| Interquartile Range (IQR) | 3.3% | 4.5% |
| Standard Deviation (Sample) | 2.7% | 2.3% |
| Standard Deviation (Population) | 2.7% | 2.2% |
Similar Demographics by 9th Grade
Demographics Similar to Koreans by 9th Grade
In terms of 9th grade, the demographic groups most similar to Koreans are Somali (94.3%, a difference of 0.0%), South American Indian (94.3%, a difference of 0.0%), Immigrants from China (94.3%, a difference of 0.0%), Immigrants from Ethiopia (94.3%, a difference of 0.010%), and Spanish American (94.2%, a difference of 0.020%).
| Demographics | Rating | Rank | 9th Grade |
| Apache | 4.2 /100 | #230 | Tragic 94.3% |
| Immigrants | Panama | 4.0 /100 | #231 | Tragic 94.3% |
| Immigrants | Africa | 3.9 /100 | #232 | Tragic 94.3% |
| Nigerians | 3.7 /100 | #233 | Tragic 94.3% |
| Costa Ricans | 3.5 /100 | #234 | Tragic 94.3% |
| Bolivians | 3.3 /100 | #235 | Tragic 94.3% |
| Somalis | 2.9 /100 | #236 | Tragic 94.3% |
| Koreans | 2.9 /100 | #237 | Tragic 94.3% |
| South American Indians | 2.8 /100 | #238 | Tragic 94.3% |
| Immigrants | China | 2.8 /100 | #239 | Tragic 94.3% |
| Immigrants | Ethiopia | 2.7 /100 | #240 | Tragic 94.3% |
| Spanish Americans | 2.6 /100 | #241 | Tragic 94.2% |
| Immigrants | Middle Africa | 2.2 /100 | #242 | Tragic 94.2% |
| Immigrants | Cameroon | 2.1 /100 | #243 | Tragic 94.2% |
| Dutch West Indians | 2.0 /100 | #244 | Tragic 94.2% |
Demographics Similar to Panamanians by 9th Grade
In terms of 9th grade, the demographic groups most similar to Panamanians are Immigrants from Northern Africa (94.7%, a difference of 0.010%), Paraguayan (94.7%, a difference of 0.010%), Marshallese (94.7%, a difference of 0.010%), Immigrants from Lebanon (94.7%, a difference of 0.020%), and Sudanese (94.7%, a difference of 0.030%).
| Demographics | Rating | Rank | 9th Grade |
| Guamanians/Chamorros | 35.5 /100 | #187 | Fair 94.8% |
| Immigrants | Albania | 34.5 /100 | #188 | Fair 94.8% |
| Immigrants | Argentina | 34.4 /100 | #189 | Fair 94.8% |
| Sudanese | 32.7 /100 | #190 | Fair 94.7% |
| Assyrians/Chaldeans/Syriacs | 32.0 /100 | #191 | Fair 94.7% |
| Immigrants | Northern Africa | 30.7 /100 | #192 | Fair 94.7% |
| Paraguayans | 30.1 /100 | #193 | Fair 94.7% |
| Panamanians | 29.0 /100 | #194 | Fair 94.7% |
| Marshallese | 27.9 /100 | #195 | Fair 94.7% |
| Immigrants | Lebanon | 27.2 /100 | #196 | Fair 94.7% |
| Immigrants | Micronesia | 24.7 /100 | #197 | Fair 94.7% |
| Hawaiians | 22.7 /100 | #198 | Fair 94.7% |
| Laotians | 21.0 /100 | #199 | Fair 94.6% |
| Immigrants | Zaire | 20.6 /100 | #200 | Fair 94.6% |
| Blacks/African Americans | 20.5 /100 | #201 | Fair 94.6% |