Korean vs Immigrants from South Central Asia 9th Grade
COMPARE
Korean
Immigrants from South Central Asia
9th Grade
9th Grade Comparison
Koreans
Immigrants from South Central Asia
94.3%
9TH GRADE
2.9/ 100
METRIC RATING
237th/ 347
METRIC RANK
95.4%
9TH GRADE
95.1/ 100
METRIC RATING
125th/ 347
METRIC RANK
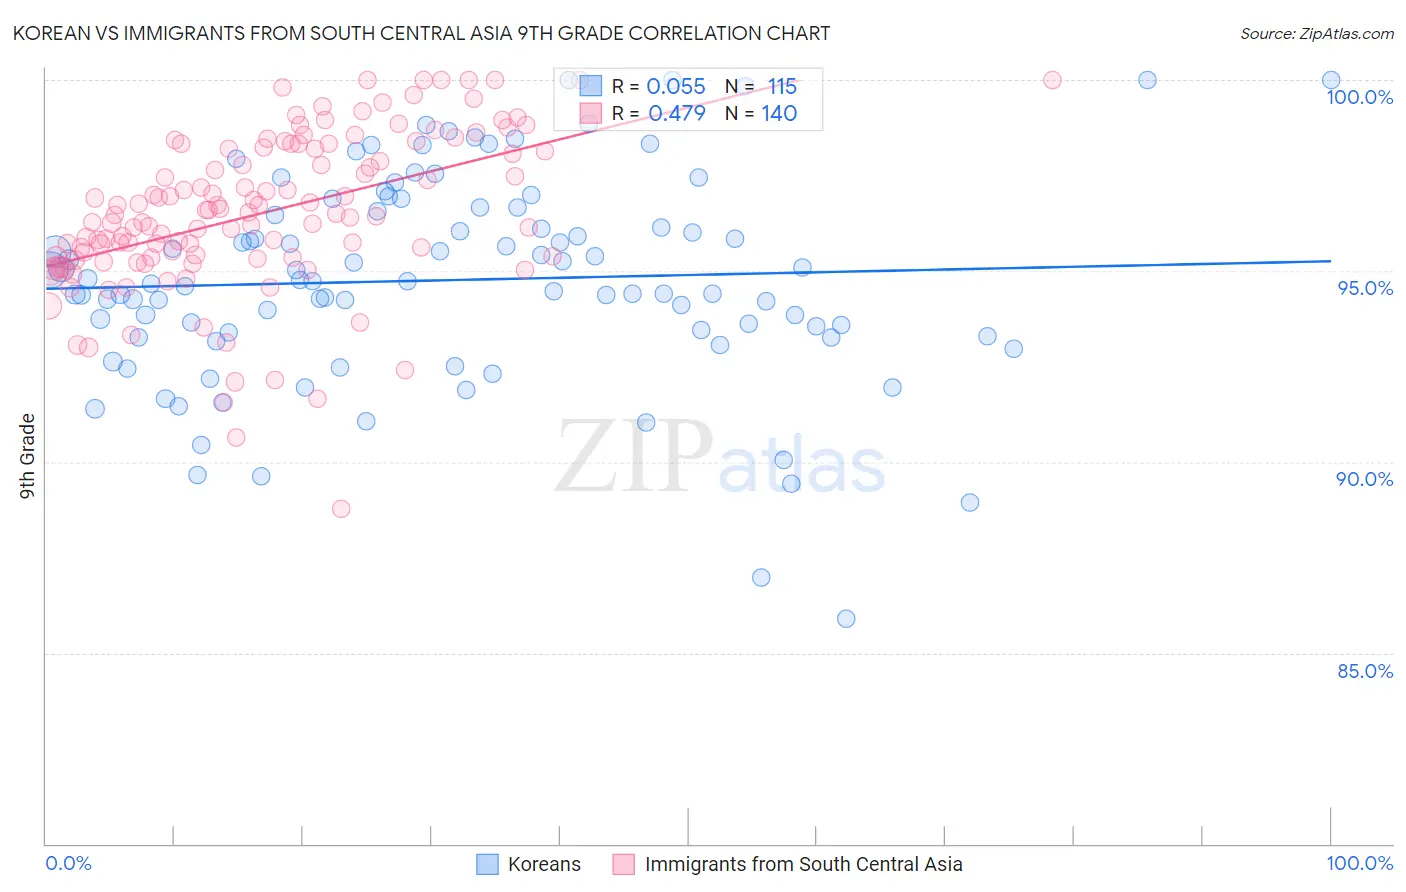
Korean vs Immigrants from South Central Asia 9th Grade Correlation Chart
The statistical analysis conducted on geographies consisting of 510,943,943 people shows a slight positive correlation between the proportion of Koreans and percentage of population with at least 9th grade education in the United States with a correlation coefficient (R) of 0.055 and weighted average of 94.3%. Similarly, the statistical analysis conducted on geographies consisting of 473,113,181 people shows a moderate positive correlation between the proportion of Immigrants from South Central Asia and percentage of population with at least 9th grade education in the United States with a correlation coefficient (R) of 0.479 and weighted average of 95.4%, a difference of 1.2%.
9th Grade Correlation Summary
| Measurement | Korean | Immigrants from South Central Asia |
| Minimum | 85.9% | 88.8% |
| Maximum | 100.0% | 100.0% |
| Range | 14.1% | 11.2% |
| Mean | 94.8% | 96.5% |
| Median | 94.7% | 96.5% |
| Interquartile 25% (IQ1) | 93.3% | 95.4% |
| Interquartile 75% (IQ3) | 96.5% | 98.2% |
| Interquartile Range (IQR) | 3.3% | 2.9% |
| Standard Deviation (Sample) | 2.7% | 2.1% |
| Standard Deviation (Population) | 2.7% | 2.1% |
Similar Demographics by 9th Grade
Demographics Similar to Koreans by 9th Grade
In terms of 9th grade, the demographic groups most similar to Koreans are Somali (94.3%, a difference of 0.0%), South American Indian (94.3%, a difference of 0.0%), Immigrants from China (94.3%, a difference of 0.0%), Immigrants from Ethiopia (94.3%, a difference of 0.010%), and Spanish American (94.2%, a difference of 0.020%).
| Demographics | Rating | Rank | 9th Grade |
| Apache | 4.2 /100 | #230 | Tragic 94.3% |
| Immigrants | Panama | 4.0 /100 | #231 | Tragic 94.3% |
| Immigrants | Africa | 3.9 /100 | #232 | Tragic 94.3% |
| Nigerians | 3.7 /100 | #233 | Tragic 94.3% |
| Costa Ricans | 3.5 /100 | #234 | Tragic 94.3% |
| Bolivians | 3.3 /100 | #235 | Tragic 94.3% |
| Somalis | 2.9 /100 | #236 | Tragic 94.3% |
| Koreans | 2.9 /100 | #237 | Tragic 94.3% |
| South American Indians | 2.8 /100 | #238 | Tragic 94.3% |
| Immigrants | China | 2.8 /100 | #239 | Tragic 94.3% |
| Immigrants | Ethiopia | 2.7 /100 | #240 | Tragic 94.3% |
| Spanish Americans | 2.6 /100 | #241 | Tragic 94.2% |
| Immigrants | Middle Africa | 2.2 /100 | #242 | Tragic 94.2% |
| Immigrants | Cameroon | 2.1 /100 | #243 | Tragic 94.2% |
| Dutch West Indians | 2.0 /100 | #244 | Tragic 94.2% |
Demographics Similar to Immigrants from South Central Asia by 9th Grade
In terms of 9th grade, the demographic groups most similar to Immigrants from South Central Asia are Kiowa (95.4%, a difference of 0.010%), Shoshone (95.4%, a difference of 0.010%), Immigrants from Turkey (95.4%, a difference of 0.020%), Soviet Union (95.4%, a difference of 0.020%), and Cambodian (95.4%, a difference of 0.020%).
| Demographics | Rating | Rank | 9th Grade |
| Immigrants | Turkey | 95.6 /100 | #118 | Exceptional 95.4% |
| Soviet Union | 95.6 /100 | #119 | Exceptional 95.4% |
| Cambodians | 95.6 /100 | #120 | Exceptional 95.4% |
| Cree | 95.5 /100 | #121 | Exceptional 95.4% |
| Immigrants | Kuwait | 95.5 /100 | #122 | Exceptional 95.4% |
| Kiowa | 95.3 /100 | #123 | Exceptional 95.4% |
| Shoshone | 95.3 /100 | #124 | Exceptional 95.4% |
| Immigrants | South Central Asia | 95.1 /100 | #125 | Exceptional 95.4% |
| Immigrants | Serbia | 94.4 /100 | #126 | Exceptional 95.4% |
| Palestinians | 94.3 /100 | #127 | Exceptional 95.4% |
| Immigrants | Hungary | 94.2 /100 | #128 | Exceptional 95.4% |
| Basques | 94.1 /100 | #129 | Exceptional 95.4% |
| Jordanians | 93.5 /100 | #130 | Exceptional 95.3% |
| Immigrants | North Macedonia | 92.3 /100 | #131 | Exceptional 95.3% |
| Immigrants | Nonimmigrants | 92.0 /100 | #132 | Exceptional 95.3% |