Korean vs Immigrants from Jamaica 9th Grade
COMPARE
Korean
Immigrants from Jamaica
9th Grade
9th Grade Comparison
Koreans
Immigrants from Jamaica
94.3%
9TH GRADE
2.9/ 100
METRIC RATING
237th/ 347
METRIC RANK
93.9%
9TH GRADE
0.4/ 100
METRIC RATING
262nd/ 347
METRIC RANK
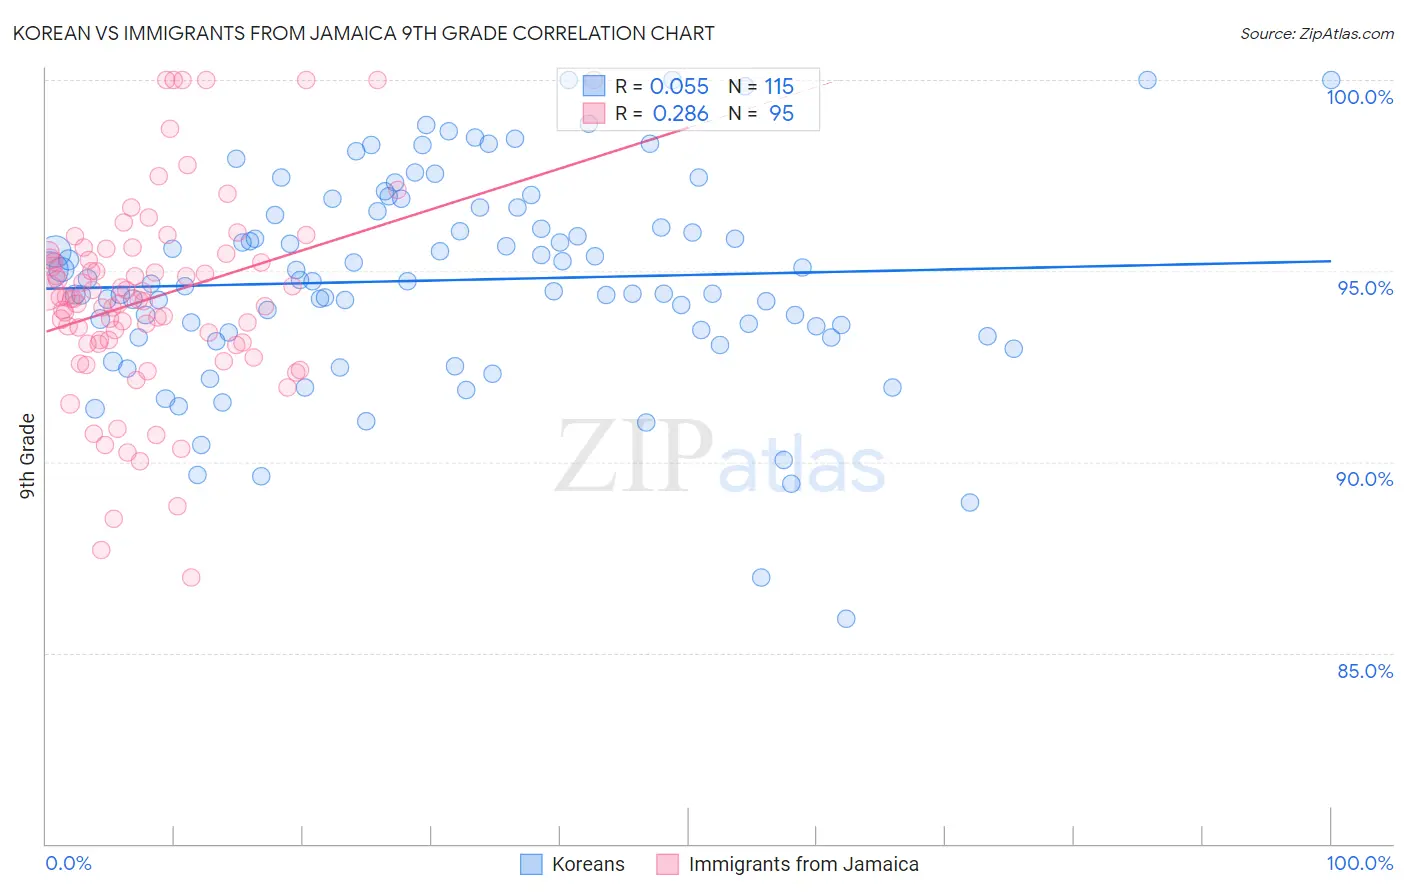
Korean vs Immigrants from Jamaica 9th Grade Correlation Chart
The statistical analysis conducted on geographies consisting of 510,943,943 people shows a slight positive correlation between the proportion of Koreans and percentage of population with at least 9th grade education in the United States with a correlation coefficient (R) of 0.055 and weighted average of 94.3%. Similarly, the statistical analysis conducted on geographies consisting of 301,829,550 people shows a weak positive correlation between the proportion of Immigrants from Jamaica and percentage of population with at least 9th grade education in the United States with a correlation coefficient (R) of 0.286 and weighted average of 93.9%, a difference of 0.37%.
9th Grade Correlation Summary
| Measurement | Korean | Immigrants from Jamaica |
| Minimum | 85.9% | 87.0% |
| Maximum | 100.0% | 100.0% |
| Range | 14.1% | 13.0% |
| Mean | 94.8% | 94.3% |
| Median | 94.7% | 94.3% |
| Interquartile 25% (IQ1) | 93.3% | 93.1% |
| Interquartile 75% (IQ3) | 96.5% | 95.5% |
| Interquartile Range (IQR) | 3.3% | 2.4% |
| Standard Deviation (Sample) | 2.7% | 2.6% |
| Standard Deviation (Population) | 2.7% | 2.6% |
Similar Demographics by 9th Grade
Demographics Similar to Koreans by 9th Grade
In terms of 9th grade, the demographic groups most similar to Koreans are Somali (94.3%, a difference of 0.0%), South American Indian (94.3%, a difference of 0.0%), Immigrants from China (94.3%, a difference of 0.0%), Immigrants from Ethiopia (94.3%, a difference of 0.010%), and Spanish American (94.2%, a difference of 0.020%).
| Demographics | Rating | Rank | 9th Grade |
| Apache | 4.2 /100 | #230 | Tragic 94.3% |
| Immigrants | Panama | 4.0 /100 | #231 | Tragic 94.3% |
| Immigrants | Africa | 3.9 /100 | #232 | Tragic 94.3% |
| Nigerians | 3.7 /100 | #233 | Tragic 94.3% |
| Costa Ricans | 3.5 /100 | #234 | Tragic 94.3% |
| Bolivians | 3.3 /100 | #235 | Tragic 94.3% |
| Somalis | 2.9 /100 | #236 | Tragic 94.3% |
| Koreans | 2.9 /100 | #237 | Tragic 94.3% |
| South American Indians | 2.8 /100 | #238 | Tragic 94.3% |
| Immigrants | China | 2.8 /100 | #239 | Tragic 94.3% |
| Immigrants | Ethiopia | 2.7 /100 | #240 | Tragic 94.3% |
| Spanish Americans | 2.6 /100 | #241 | Tragic 94.2% |
| Immigrants | Middle Africa | 2.2 /100 | #242 | Tragic 94.2% |
| Immigrants | Cameroon | 2.1 /100 | #243 | Tragic 94.2% |
| Dutch West Indians | 2.0 /100 | #244 | Tragic 94.2% |
Demographics Similar to Immigrants from Jamaica by 9th Grade
In terms of 9th grade, the demographic groups most similar to Immigrants from Jamaica are Immigrants from Uzbekistan (93.9%, a difference of 0.010%), Immigrants from Congo (93.9%, a difference of 0.010%), Native/Alaskan (93.9%, a difference of 0.010%), Pima (93.9%, a difference of 0.020%), and South American (93.9%, a difference of 0.020%).
| Demographics | Rating | Rank | 9th Grade |
| Immigrants | Nigeria | 0.6 /100 | #255 | Tragic 94.0% |
| Immigrants | Afghanistan | 0.5 /100 | #256 | Tragic 94.0% |
| Immigrants | Costa Rica | 0.5 /100 | #257 | Tragic 94.0% |
| Immigrants | Thailand | 0.5 /100 | #258 | Tragic 93.9% |
| Ghanaians | 0.5 /100 | #259 | Tragic 93.9% |
| Pima | 0.4 /100 | #260 | Tragic 93.9% |
| South Americans | 0.4 /100 | #261 | Tragic 93.9% |
| Immigrants | Jamaica | 0.4 /100 | #262 | Tragic 93.9% |
| Immigrants | Uzbekistan | 0.4 /100 | #263 | Tragic 93.9% |
| Immigrants | Congo | 0.4 /100 | #264 | Tragic 93.9% |
| Natives/Alaskans | 0.4 /100 | #265 | Tragic 93.9% |
| Navajo | 0.3 /100 | #266 | Tragic 93.9% |
| Armenians | 0.3 /100 | #267 | Tragic 93.9% |
| Immigrants | Bolivia | 0.3 /100 | #268 | Tragic 93.9% |
| Immigrants | Uruguay | 0.2 /100 | #269 | Tragic 93.8% |