Korean vs Dutch Doctorate Degree
COMPARE
Korean
Dutch
Doctorate Degree
Doctorate Degree Comparison
Koreans
Dutch
1.7%
DOCTORATE DEGREE
14.2/ 100
METRIC RATING
213th/ 347
METRIC RANK
1.8%
DOCTORATE DEGREE
27.4/ 100
METRIC RATING
192nd/ 347
METRIC RANK
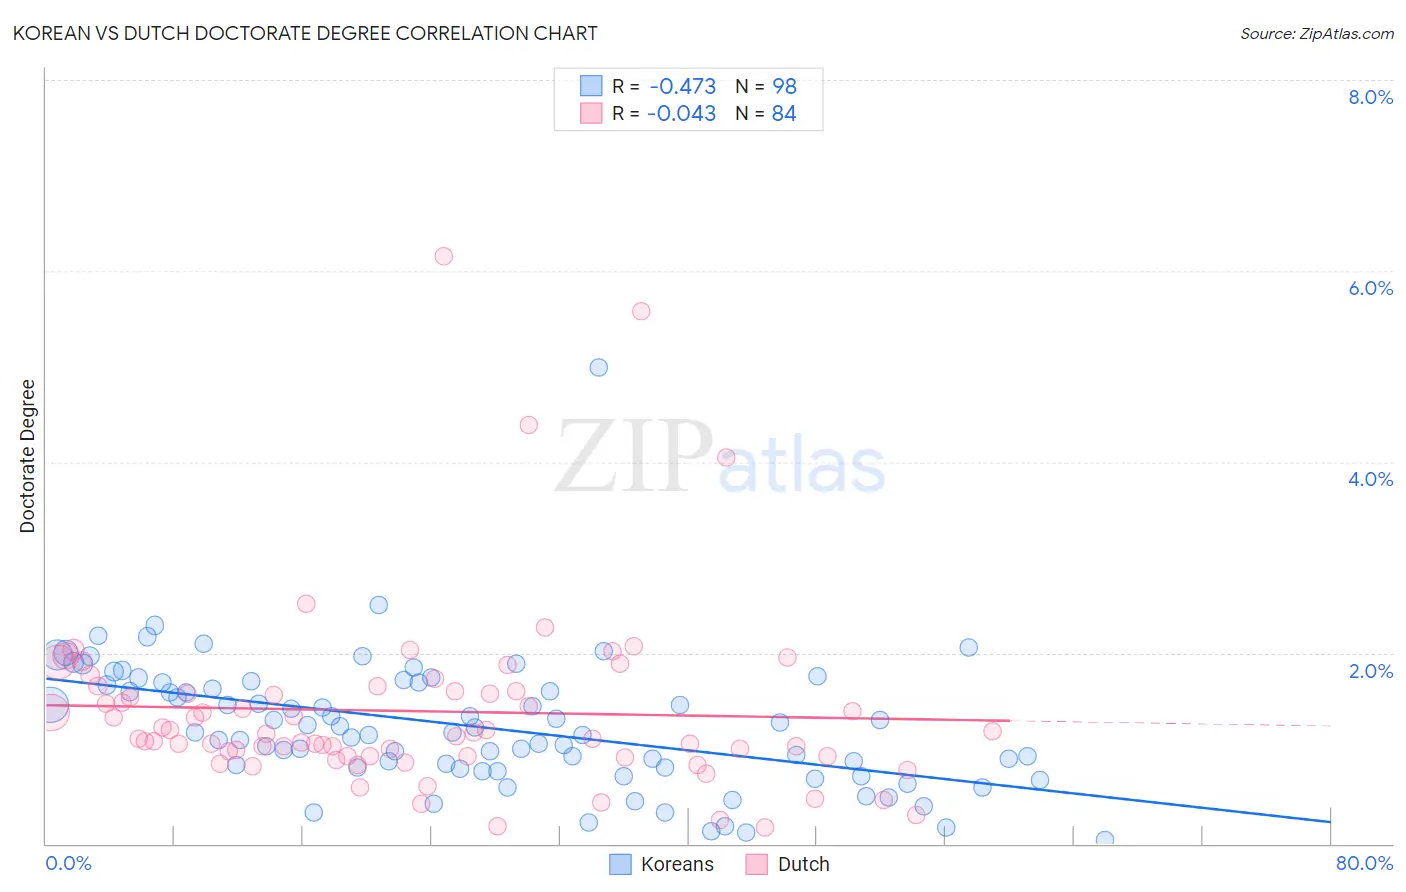
Korean vs Dutch Doctorate Degree Correlation Chart
The statistical analysis conducted on geographies consisting of 500,370,759 people shows a moderate negative correlation between the proportion of Koreans and percentage of population with at least doctorate degree education in the United States with a correlation coefficient (R) of -0.473 and weighted average of 1.7%. Similarly, the statistical analysis conducted on geographies consisting of 532,685,178 people shows no correlation between the proportion of Dutch and percentage of population with at least doctorate degree education in the United States with a correlation coefficient (R) of -0.043 and weighted average of 1.8%, a difference of 3.2%.
Doctorate Degree Correlation Summary
| Measurement | Korean | Dutch |
| Minimum | 0.043% | 0.18% |
| Maximum | 5.0% | 6.2% |
| Range | 4.9% | 6.0% |
| Mean | 1.2% | 1.4% |
| Median | 1.2% | 1.1% |
| Interquartile 25% (IQ1) | 0.80% | 0.91% |
| Interquartile 75% (IQ3) | 1.7% | 1.6% |
| Interquartile Range (IQR) | 0.88% | 0.68% |
| Standard Deviation (Sample) | 0.69% | 0.98% |
| Standard Deviation (Population) | 0.68% | 0.97% |
Similar Demographics by Doctorate Degree
Demographics Similar to Koreans by Doctorate Degree
In terms of doctorate degree, the demographic groups most similar to Koreans are Pueblo (1.7%, a difference of 0.010%), Immigrants from South Eastern Asia (1.7%, a difference of 0.15%), Alaskan Athabascan (1.7%, a difference of 0.15%), Immigrants from Burma/Myanmar (1.7%, a difference of 0.25%), and Immigrants from Armenia (1.7%, a difference of 0.27%).
| Demographics | Rating | Rank | Doctorate Degree |
| Immigrants | Peru | 17.6 /100 | #206 | Poor 1.7% |
| Yugoslavians | 17.1 /100 | #207 | Poor 1.7% |
| Colombians | 16.1 /100 | #208 | Poor 1.7% |
| Immigrants | Western Africa | 15.4 /100 | #209 | Poor 1.7% |
| Tongans | 15.1 /100 | #210 | Poor 1.7% |
| Immigrants | Armenia | 15.1 /100 | #211 | Poor 1.7% |
| Immigrants | South Eastern Asia | 14.7 /100 | #212 | Poor 1.7% |
| Koreans | 14.2 /100 | #213 | Poor 1.7% |
| Pueblo | 14.2 /100 | #214 | Poor 1.7% |
| Alaskan Athabascans | 13.8 /100 | #215 | Poor 1.7% |
| Immigrants | Burma/Myanmar | 13.5 /100 | #216 | Poor 1.7% |
| Spanish Americans | 12.9 /100 | #217 | Poor 1.7% |
| Tlingit-Haida | 11.9 /100 | #218 | Poor 1.7% |
| Immigrants | Iraq | 10.7 /100 | #219 | Poor 1.7% |
| Immigrants | Uruguay | 9.2 /100 | #220 | Tragic 1.7% |
Demographics Similar to Dutch by Doctorate Degree
In terms of doctorate degree, the demographic groups most similar to Dutch are German Russian (1.8%, a difference of 0.070%), Uruguayan (1.8%, a difference of 0.24%), South American (1.8%, a difference of 0.39%), Immigrants from Somalia (1.8%, a difference of 0.39%), and Subsaharan African (1.8%, a difference of 0.46%).
| Demographics | Rating | Rank | Doctorate Degree |
| Slovaks | 36.4 /100 | #185 | Fair 1.8% |
| Peruvians | 34.4 /100 | #186 | Fair 1.8% |
| Czechoslovakians | 33.0 /100 | #187 | Fair 1.8% |
| Germans | 30.5 /100 | #188 | Fair 1.8% |
| French Canadians | 30.2 /100 | #189 | Fair 1.8% |
| Immigrants | Costa Rica | 30.2 /100 | #190 | Fair 1.8% |
| South Americans | 29.5 /100 | #191 | Fair 1.8% |
| Dutch | 27.4 /100 | #192 | Fair 1.8% |
| German Russians | 27.1 /100 | #193 | Fair 1.8% |
| Uruguayans | 26.2 /100 | #194 | Fair 1.8% |
| Immigrants | Somalia | 25.4 /100 | #195 | Fair 1.8% |
| Sub-Saharan Africans | 25.1 /100 | #196 | Fair 1.8% |
| Chinese | 25.1 /100 | #197 | Fair 1.8% |
| Immigrants | Ghana | 24.6 /100 | #198 | Fair 1.8% |
| Immigrants | South America | 23.3 /100 | #199 | Fair 1.8% |