Korean vs Czechoslovakian Doctorate Degree
COMPARE
Korean
Czechoslovakian
Doctorate Degree
Doctorate Degree Comparison
Koreans
Czechoslovakians
1.7%
DOCTORATE DEGREE
14.2/ 100
METRIC RATING
213th/ 347
METRIC RANK
1.8%
DOCTORATE DEGREE
33.0/ 100
METRIC RATING
187th/ 347
METRIC RANK
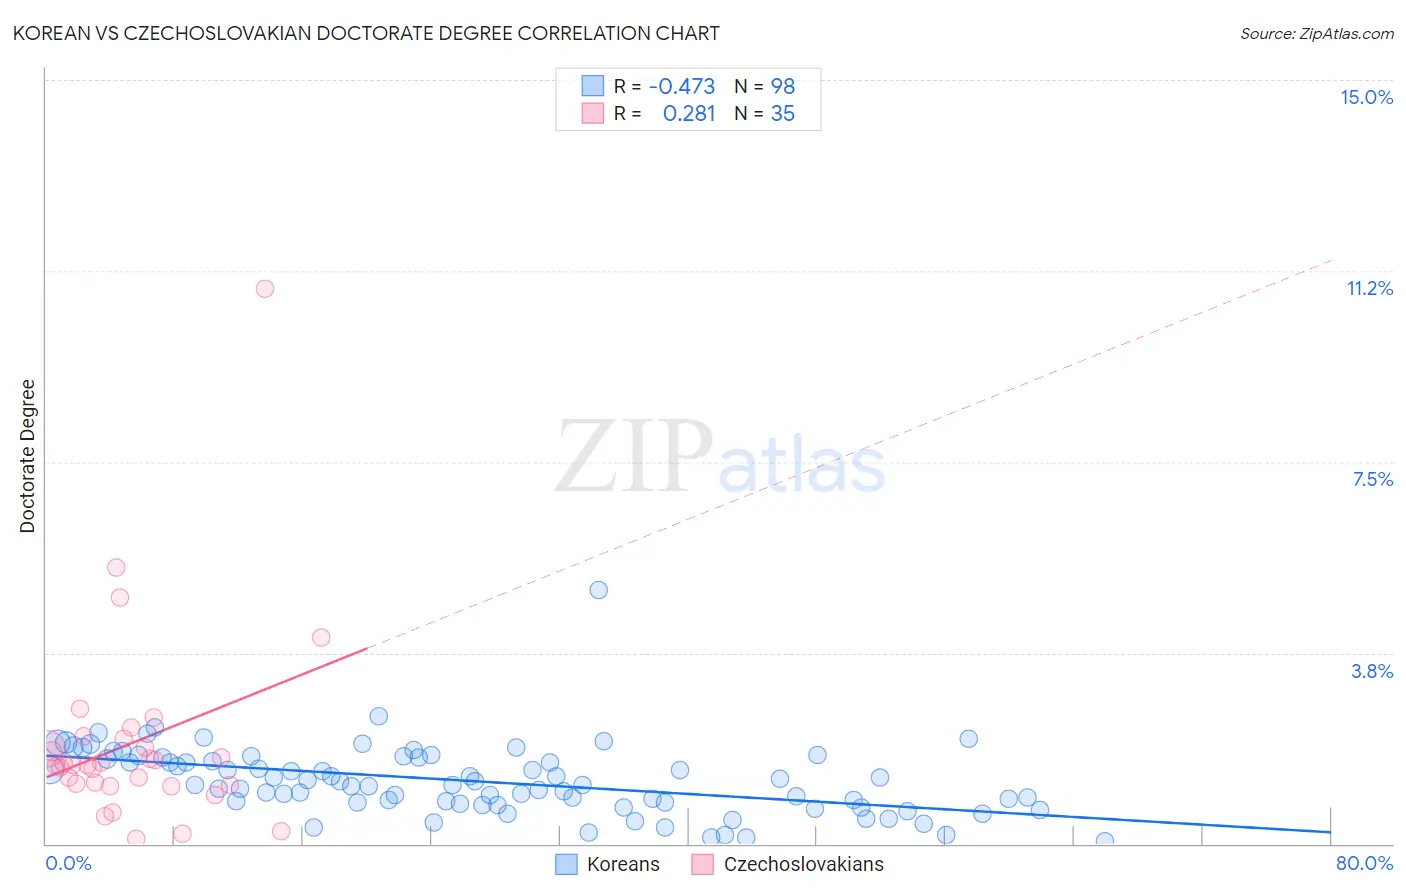
Korean vs Czechoslovakian Doctorate Degree Correlation Chart
The statistical analysis conducted on geographies consisting of 500,370,759 people shows a moderate negative correlation between the proportion of Koreans and percentage of population with at least doctorate degree education in the United States with a correlation coefficient (R) of -0.473 and weighted average of 1.7%. Similarly, the statistical analysis conducted on geographies consisting of 364,136,650 people shows a weak positive correlation between the proportion of Czechoslovakians and percentage of population with at least doctorate degree education in the United States with a correlation coefficient (R) of 0.281 and weighted average of 1.8%, a difference of 4.3%.
Doctorate Degree Correlation Summary
| Measurement | Korean | Czechoslovakian |
| Minimum | 0.043% | 0.10% |
| Maximum | 5.0% | 10.9% |
| Range | 4.9% | 10.8% |
| Mean | 1.2% | 2.0% |
| Median | 1.2% | 1.6% |
| Interquartile 25% (IQ1) | 0.80% | 1.1% |
| Interquartile 75% (IQ3) | 1.7% | 2.1% |
| Interquartile Range (IQR) | 0.88% | 0.92% |
| Standard Deviation (Sample) | 0.69% | 1.9% |
| Standard Deviation (Population) | 0.68% | 1.9% |
Similar Demographics by Doctorate Degree
Demographics Similar to Koreans by Doctorate Degree
In terms of doctorate degree, the demographic groups most similar to Koreans are Pueblo (1.7%, a difference of 0.010%), Immigrants from South Eastern Asia (1.7%, a difference of 0.15%), Alaskan Athabascan (1.7%, a difference of 0.15%), Immigrants from Burma/Myanmar (1.7%, a difference of 0.25%), and Immigrants from Armenia (1.7%, a difference of 0.27%).
| Demographics | Rating | Rank | Doctorate Degree |
| Immigrants | Peru | 17.6 /100 | #206 | Poor 1.7% |
| Yugoslavians | 17.1 /100 | #207 | Poor 1.7% |
| Colombians | 16.1 /100 | #208 | Poor 1.7% |
| Immigrants | Western Africa | 15.4 /100 | #209 | Poor 1.7% |
| Tongans | 15.1 /100 | #210 | Poor 1.7% |
| Immigrants | Armenia | 15.1 /100 | #211 | Poor 1.7% |
| Immigrants | South Eastern Asia | 14.7 /100 | #212 | Poor 1.7% |
| Koreans | 14.2 /100 | #213 | Poor 1.7% |
| Pueblo | 14.2 /100 | #214 | Poor 1.7% |
| Alaskan Athabascans | 13.8 /100 | #215 | Poor 1.7% |
| Immigrants | Burma/Myanmar | 13.5 /100 | #216 | Poor 1.7% |
| Spanish Americans | 12.9 /100 | #217 | Poor 1.7% |
| Tlingit-Haida | 11.9 /100 | #218 | Poor 1.7% |
| Immigrants | Iraq | 10.7 /100 | #219 | Poor 1.7% |
| Immigrants | Uruguay | 9.2 /100 | #220 | Tragic 1.7% |
Demographics Similar to Czechoslovakians by Doctorate Degree
In terms of doctorate degree, the demographic groups most similar to Czechoslovakians are Peruvian (1.8%, a difference of 0.23%), German (1.8%, a difference of 0.45%), French Canadian (1.8%, a difference of 0.49%), Immigrants from Costa Rica (1.8%, a difference of 0.50%), and Slovak (1.8%, a difference of 0.55%).
| Demographics | Rating | Rank | Doctorate Degree |
| Scandinavians | 48.0 /100 | #180 | Average 1.8% |
| Immigrants | Immigrants | 46.2 /100 | #181 | Average 1.8% |
| Immigrants | Afghanistan | 44.3 /100 | #182 | Average 1.8% |
| Finns | 42.1 /100 | #183 | Average 1.8% |
| Nigerians | 39.9 /100 | #184 | Fair 1.8% |
| Slovaks | 36.4 /100 | #185 | Fair 1.8% |
| Peruvians | 34.4 /100 | #186 | Fair 1.8% |
| Czechoslovakians | 33.0 /100 | #187 | Fair 1.8% |
| Germans | 30.5 /100 | #188 | Fair 1.8% |
| French Canadians | 30.2 /100 | #189 | Fair 1.8% |
| Immigrants | Costa Rica | 30.2 /100 | #190 | Fair 1.8% |
| South Americans | 29.5 /100 | #191 | Fair 1.8% |
| Dutch | 27.4 /100 | #192 | Fair 1.8% |
| German Russians | 27.1 /100 | #193 | Fair 1.8% |
| Uruguayans | 26.2 /100 | #194 | Fair 1.8% |