Paiute vs Dutch Doctorate Degree
COMPARE
Paiute
Dutch
Doctorate Degree
Doctorate Degree Comparison
Paiute
Dutch
1.5%
DOCTORATE DEGREE
0.4/ 100
METRIC RATING
276th/ 347
METRIC RANK
1.8%
DOCTORATE DEGREE
27.4/ 100
METRIC RATING
192nd/ 347
METRIC RANK
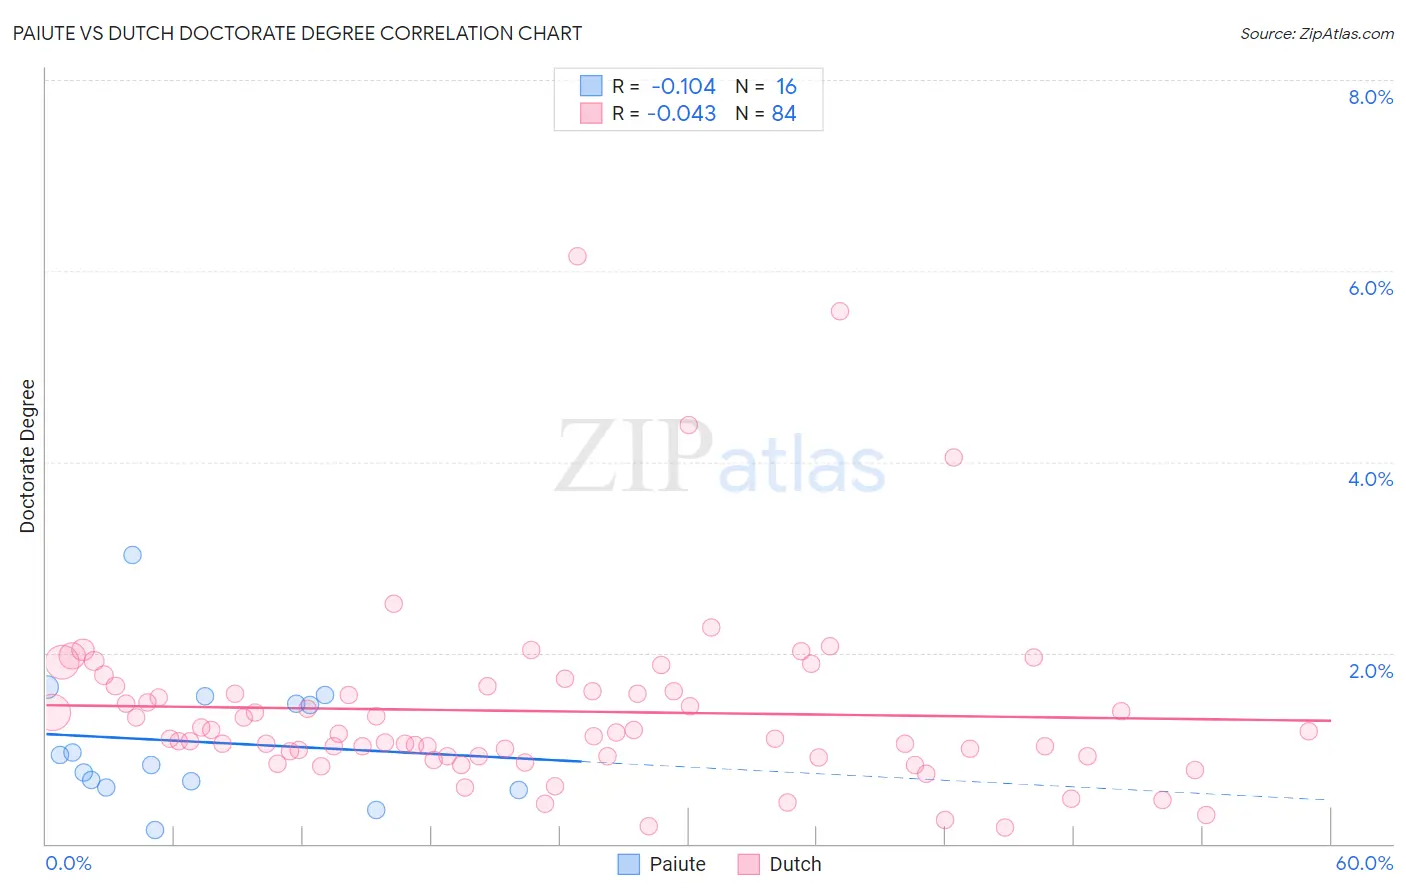
Paiute vs Dutch Doctorate Degree Correlation Chart
The statistical analysis conducted on geographies consisting of 58,124,272 people shows a poor negative correlation between the proportion of Paiute and percentage of population with at least doctorate degree education in the United States with a correlation coefficient (R) of -0.104 and weighted average of 1.5%. Similarly, the statistical analysis conducted on geographies consisting of 532,685,178 people shows no correlation between the proportion of Dutch and percentage of population with at least doctorate degree education in the United States with a correlation coefficient (R) of -0.043 and weighted average of 1.8%, a difference of 20.6%.
Doctorate Degree Correlation Summary
| Measurement | Paiute | Dutch |
| Minimum | 0.15% | 0.18% |
| Maximum | 3.0% | 6.2% |
| Range | 2.9% | 6.0% |
| Mean | 1.1% | 1.4% |
| Median | 0.88% | 1.1% |
| Interquartile 25% (IQ1) | 0.62% | 0.91% |
| Interquartile 75% (IQ3) | 1.5% | 1.6% |
| Interquartile Range (IQR) | 0.88% | 0.68% |
| Standard Deviation (Sample) | 0.70% | 0.98% |
| Standard Deviation (Population) | 0.67% | 0.97% |
Similar Demographics by Doctorate Degree
Demographics Similar to Paiute by Doctorate Degree
In terms of doctorate degree, the demographic groups most similar to Paiute are Aleut (1.5%, a difference of 0.050%), Yaqui (1.5%, a difference of 0.17%), Sioux (1.5%, a difference of 0.19%), Immigrants from Barbados (1.5%, a difference of 0.30%), and Immigrants from Trinidad and Tobago (1.5%, a difference of 0.39%).
| Demographics | Rating | Rank | Doctorate Degree |
| Crow | 0.5 /100 | #269 | Tragic 1.5% |
| Salvadorans | 0.5 /100 | #270 | Tragic 1.5% |
| Immigrants | Trinidad and Tobago | 0.5 /100 | #271 | Tragic 1.5% |
| Immigrants | Barbados | 0.4 /100 | #272 | Tragic 1.5% |
| Sioux | 0.4 /100 | #273 | Tragic 1.5% |
| Yaqui | 0.4 /100 | #274 | Tragic 1.5% |
| Aleuts | 0.4 /100 | #275 | Tragic 1.5% |
| Paiute | 0.4 /100 | #276 | Tragic 1.5% |
| Bahamians | 0.4 /100 | #277 | Tragic 1.5% |
| Hawaiians | 0.4 /100 | #278 | Tragic 1.5% |
| Marshallese | 0.4 /100 | #279 | Tragic 1.5% |
| Ecuadorians | 0.4 /100 | #280 | Tragic 1.5% |
| Tohono O'odham | 0.4 /100 | #281 | Tragic 1.5% |
| British West Indians | 0.3 /100 | #282 | Tragic 1.5% |
| Central Americans | 0.3 /100 | #283 | Tragic 1.5% |
Demographics Similar to Dutch by Doctorate Degree
In terms of doctorate degree, the demographic groups most similar to Dutch are German Russian (1.8%, a difference of 0.070%), Uruguayan (1.8%, a difference of 0.24%), South American (1.8%, a difference of 0.39%), Immigrants from Somalia (1.8%, a difference of 0.39%), and Subsaharan African (1.8%, a difference of 0.46%).
| Demographics | Rating | Rank | Doctorate Degree |
| Slovaks | 36.4 /100 | #185 | Fair 1.8% |
| Peruvians | 34.4 /100 | #186 | Fair 1.8% |
| Czechoslovakians | 33.0 /100 | #187 | Fair 1.8% |
| Germans | 30.5 /100 | #188 | Fair 1.8% |
| French Canadians | 30.2 /100 | #189 | Fair 1.8% |
| Immigrants | Costa Rica | 30.2 /100 | #190 | Fair 1.8% |
| South Americans | 29.5 /100 | #191 | Fair 1.8% |
| Dutch | 27.4 /100 | #192 | Fair 1.8% |
| German Russians | 27.1 /100 | #193 | Fair 1.8% |
| Uruguayans | 26.2 /100 | #194 | Fair 1.8% |
| Immigrants | Somalia | 25.4 /100 | #195 | Fair 1.8% |
| Sub-Saharan Africans | 25.1 /100 | #196 | Fair 1.8% |
| Chinese | 25.1 /100 | #197 | Fair 1.8% |
| Immigrants | Ghana | 24.6 /100 | #198 | Fair 1.8% |
| Immigrants | South America | 23.3 /100 | #199 | Fair 1.8% |